ЭКОЛОГИЧЕСКИЕ КАРТЫ И ИХ ОТЛИЧИЕ ОТ КАРТ ПО ОКРУЖАЮЩЕЙ СРЕДЕ
1Тихоокеанский институт географии ДВО РАН, доктор биологических наук, лаборатория биогеографии и экологии
2Ботанический сад-институт ДВО РАН, доктор биологических наук, заведующий лабораторией экологии растительного покрова
3Ботанический сад-институт ДВО РАН, кандидат физико-математических наук, лаборатория экологии растительного покрова
4Ботанический сад-институт ДВО РАН, кандидат биологических наук, старший научный сотрудник.лаборатории экологии растительного покрова
Аннотация
Впервые разработаны алгоритмы автоматического построения экологических карт и построен фрагмент экологической карты для таежной экосистемы Приморья
ECOLOGICAL MAPS AND THEIR DIFFERENCES FROM THE ENVIRONMENTAL
1Pacific Geographical Institute FEBRAS, Vladivostok, Russia, doctor of biological sciences, professor, Laboratory of biogeography and ecology
2Botanical Garden Institute, FEBRAS, Vladivostok, Rusia, doctor of biological sciences, Head of Laboratory of Ecology of vegetation
3Botanical Garden Institute, FEBRAS, Vladivostok, Rusia, candidate of physico-mathematical Sciences, Laboratory of Ecology of vegetation
4Botanical Garden Institute, FEBRAS, Vladivostok, Rusia, candidate of biological Sciences, Senior Researcher, Laboratory of Ecology of vegetation
Abstract
An algorithm for environment map construction is suggested based on the comparative analysis of the relationships between environmental factors and categories of biota,
the integral measures of consistency between random events and the measure of similarity between descriptive sets being used. For probability measures, the variance formulae are given. A fragment of an ecological map is constructed for the given region of the taiga ecosystem.
Keywords: ecological maps, environmental maps
Рубрика: 11.00.00 ГЕОГРАФИЧЕСКИЕ НАУКИ
Библиографическая ссылка на статью:
Семкин Б.И., Петропавловский Б.С., Кислов Д.Е., Брижатая А.А. Экологические карты и их отличие от карт по окружающей среде // Современные научные исследования и инновации. 2015. № 8. Ч. 2 [Электронный ресурс]. URL: https://web.snauka.ru/issues/2015/08/56843 (дата обращения: 31.07.2026).
Ecological map is built on the composition of relations between environmental features and types of biota. Complexity of the problem of building ecological maps is defined by the fact, that environmental features and types of biota are measured in different scales (qualitative and quantitative scales). Thereby we should use categorized data in order to match these different measurements. To create ecological map all territory under study must be covered with a regular net; data for future processing is picked up from the nodes of the net. Sampling of nodes is performed randomly, by choosing nodes from the totality, or considering only a part of nodes picked up in a regular order. For every pair of environmental and biotic features, as well for types of biota and environmental features separately, we calculate adjacency matrices for categorized data. These matrices are source of data that used for plotting typological ecological map [3,4,5].
Plant ordination by environmental features [1,2] is performed on the basis of adjacency matrices of biotic and environmental features.
Therefore, ecological map reflects dimensionless relations between categories (types) of biota and environmental features. Finally, we map not absolute features, but their inter-relations. We are the first ones who developed such algorithms for automatic plotting ecological maps and plotted a part of the ecological map for Primorye taiga ecosystem [3-5]. Concerning environmental maps, they are used in environmental conservation practice for a long time. Environmental mapping is a part of geographic ecology on the landscape (topological), regional and global levels.
Geographical ecology studies relationships between biota and environment for determined levels.
These relations are presented as ecological maps.
To construct ecological maps using the approach suggested, we developed a program, ECO MAP, in MatLab v. 7.5. The program makes it possible to calculate the matrices of the cross classification of categories of biota and environmental factors, to construct descriptive sets based on them, and to perform their cluster analysis based on standard facilities of the MatLab.
Consider the example of the construction of an ecological map of the Dal‘nevostochnyi forestry enterprise (Primorskii Krai, Ussuriyskii raion). Constructing an ecological map for the territory of the Dal‘nevostochnyi forestry enterprise, a training sample based on forest taxation descriptions was used, with 1000 points being chosen randomly from the set of those regularly (in the nodes of a grid of 500 × 500 m) placed over the entire territory of the for estry enterprise. The following factors were taken into account: altitude above sea level (13 gradations), gradient of slope (seven gradations), and slope exposure (eight gradations). Biota categories were represented by the dominant of the forest stand. Forming matrices describing contingency, Iversen‘s measure was calculated. The clusterization of descriptive sets was carried out by the k means method (k = 4) (MatLab built inprocedure). To obtain smooth contours of environmental clusters, a smoothing algorithm was additionally used. It selected the current position of a class that was the most represented among the 10 nearest points. The comparison of the ecological map obtained with the initial distribution of the dominant of the forest stand makes it possible to suggest a correlation between them. In particular, triangular hatching in figure highlights the regions that correspond to forest blocks with yezo spruce prevailing; hexagon hatching highlights the regions that correspond to forest blocks with rhynofolious ash prevailing.
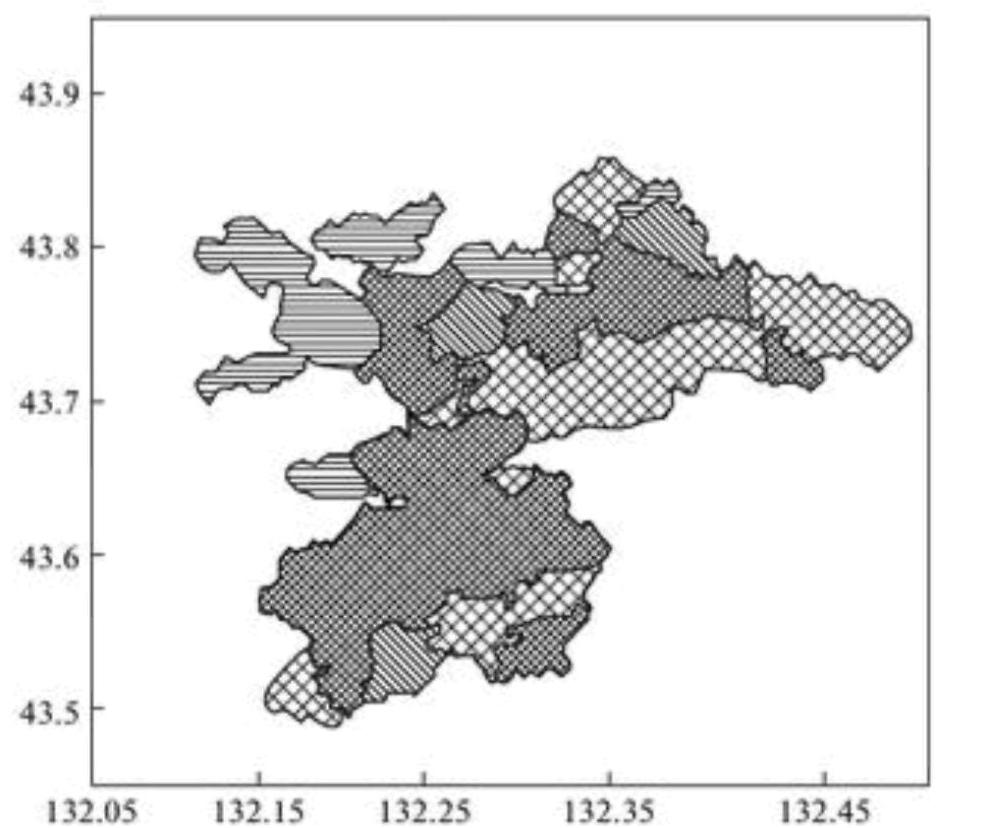
Fig. 1 – The ecological map of the Far Eastern forestry enterprise (X axis or longitude, deg; Y axis or latitude, deg); hatching highlights areas of different clusters
References
- Semkin B.I., Petropavlovskii B.S., Koshkarev A.V., Varchenko L.I., Usoltceva L.A. About method of multivariate analysis of relations between vegetation and ecological factors. // Bot. journal. 1986. Vol. 71. Issue 9. P. 1167-1181.
- Brizhataya A.A., Kislov D.E. Comparative analysis of forest restoration methods based on environment factors // Bulletin of Bot. Garden- Institute FEB RAS. 2009. Issue 3. P. 102-110.
- Semkin B.I., Petropavlovsky B.S., Kislov D.E., Brizhataya A.A. Using bioinformatics technologies for building ecological maps // Forests of the Russian Far East: monitoring of the forest dynamics on the Russian Far East: materials of the V All-Russian conference, - Vladivostok: LAINS, 2012. – P. 201-204.
- Semkin B.I., Petropavlovsky B.S., Kislov D.E., Zuev Yu. F. A study on the use bioinformatic technigues for environmental mapping // Pattern recognition and Image Understanding 8th Open German-Russion Workshop – Nizhnii Novgorod: 2011. – Pp. 262-264.
- Semkin B.I., Petropavlovsky B.S., Kislov D.E., Zuev Yu. F. Bioinfomatics Technologies in the Construction of Environmental Maps // Pattern recognition in Image Analysis, 2014, Vol. 24, No 1, Pp. 144-150.
Все статьи автора «Коробов Виталий Викторович»
© Если вы обнаружили нарушение авторских или смежных прав, пожалуйста, незамедлительно сообщите нам об этом по электронной почте.