Π-TEST AND MONTE CARLO OPTIMIZATION OF PSEUDO-RANDOM SEQUENCE GENERATORS
Transoffice-Information GbR
PhD, Chief Technology, Filderstadt (Germany)
Abstract
A formulation of the problem is considered, in which Monte Carlo methods are used to evaluate the quality of pseudo-random sequence generators. Within the framework of this formulation of the problem, a so-called π-Test is proposed that can be used to test any pseudo-random sequence generators with the uniform distribution law. By means of π-Test, a criterion is formulated to optimize the generators of pseudo-random sequences with the uniform distribution law. The results of computer simulation are presented.
Keywords: linear congruence method, Monte Carlo methods, optimization of the pseudo-random sequence generator, test, uniform distribution law
Category: 01.00.00 Physics and mathematics
Article reference:
Soutchilin V. π-Test and Monte Carlo Optimization of Pseudo-Random Sequence Generators // Modern scientific researches and innovations. 2018. № 8 [Electronic journal]. URL: https://web.snauka.ru/en/issues/2018/08/87545
 View this article in Russian
 Introduction
Pseudo-random sequence generators (PRSG) today are an integral part of fast any application software [1]. Among them, an important role is played by PRSGs with the uniform distribution law from which PRSGs with any other distribution law can be obtained through a transform. In this regard, it is important to be ensured what is about a good quality of the uniform distribution to be used. To do this, there are various methods for PRSG testing [2].
In this paper, we offer the simple to implement test, as well as a method based on Monte Carlo methods for optimizing PRSGs with the uniform distribution law [3].
Using Monte Carlo methods
In Monte Carlo methods, a PRSG is usually first selected, and on its basis the required estimation of the object under study is formed. We will proceed, on the contrary, from the reference value of the required evaluation, in order to estimate on its basis the real quality of PRSG. To do this, we consider a definite integral:
S = ![]() (1)
(1)
Note that since this integral is a well-known one (namely, S = π/2 [4]), it can be just used as the required reference value.
Calculation of the integral (1) by Monte Carlo methods has to do with the well-known mathematical model [3]. In this model, points within a unit square in which the unit circle is inscribed are randomly sampled, and then the ratio of the number of points M being sampled in the unit circle to the total number of selected points N is determined. In this case, it can be obtained:
π ≈ 4·M / N (2)
In the case of an ideal PRSG, the calculation accuracy through this model increases in proportion to the number of sampled points. However, real PRSGs (for example, due to the pseudo-random sequence generation method being used) often do not provide the desired quality of uniform distribution [5].
In this case, the quality of a PRSG estimated by means of how accurately the number π is determined. This procedure, which we call then “π-Test”, can be used to evaluate the quality of any PRSG with the uniform distribution law. Below we provide two modules the first of which implements the π-Test (specifically using the function Math.GetRandomNumber [6]), and the second provides a pseudo-random sequence based on the linear congruential method (LCM) [2].
Notes:
1. The program modules presented below are intellectual property, and their use requires a reference to this article.
2. The values of Par1, Par2, Par3 by the second module are part of the author’s know-how and can be provided upon request.
Table 1 - Module π-Test
| ‘GetRandomNumber Pi-Test by Method Monte-CarloN=Math.Power(10,5)
z=Math.Power(10,7) CycleNumber =0 Wid: CycleNumber= CycleNumber+1 M=0 For i = 1 to N x=Math.GetRandomNumber(z)/z-0.5 y=Math.GetRandomNumber(z)/z-0.5 If (x*x+y*y) <= 0.25 Then M=M+1 EndIf Endfor PiValue=4*M/N ‘Determination of mean of the sample MeanPiValue=(MeanPiValue*(CycleNumber-1)+PiValue)/CycleNumber textwindow.Write(” “+MeanPiValue) If CycleNumber < 25 Then Goto Wid EndIf ‘End of program |
Table 2 - Module LCM
| ‘Modificated LCG {0,1}Sub LCG
g1=Par1*RandValue g2=Math.Floor(g1) g3=g1-g2 ga=g3*Par2 gb=g3*Par3 RandValue=gb-ga ODV: ‘Normalisation If RandValue > 1 Then RandValue=RandValue/10 Goto ODV EndIf EndSub |
The results of the π-Test with Math.GetRandomNumber are shown in the diagram below. For comparison, here are also the results based on the LCM. The reference points on the diagram correspond to the average estimation for π as the number of cycle’s increases.
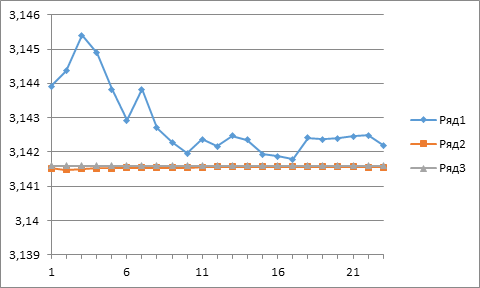
Series1 – Based on Math.GetRandomNumber
Series2 – Based on the LCM
Series3 – Level of π
This diagram clearly shows that the quality of the standard PRSG generator leaves much to be desired. Here, indeed, compared to the LCM, the standard PRSG has two disadvantages.
First, it has a relatively large variance, which is indicated by the phase of “acceleration” (the first 10 points of the diagram).
Secondly, at the stationary section (points 11 to 23), the accuracy of approximation π does not exceed the 2nd decimal place, while in the case of the LCM it is provided by 4 decimal place.
This can be explained by the fact that in this model the generated points are distributed unevenly in the unit square. At the same time, their density in the unit circle occurs to be higher.
In addition, the results of the π-Test illustrate the fact that the quality of different PRSG can vary significantly [5].
Optimization of PRSG
To optimize a PRSG with the uniform distribution law, one can use the quadratic criterion [7]:
E => min (ӯ – a)2 (3)
Ф(μ,y))
where
ӯ –sample mean
а –reference value
Note, the function Ф(μ,y) has a similarity to the functions that are used to the pseudo-random sequence, for example, to a normal distribution (Box-Muller transform [2]). However, in this mathematical model, this function serves only to correct the distribution law in order to improve the quality of PRSG.
We consider the above formulation of the problem as applied to a correcting function of the form:
Ф(μ,y) =(y +μ·sin(yπ)) (4)
where y is a random variable in the {0,1} interval formed by the standard PRSG generator and μ is a small parameter (| μ | << 1), since, as a rule, only an insignificant correction of the distribution law of the PRSG is required for optimization. Note, with this definition, in addition, the following necessary relations are satisfied:
0 > Ф(μ, y) < 1 (5)
Ф(0, y) = y
Below are the configurations of the function (5) for the three main cases of the parameter μ.
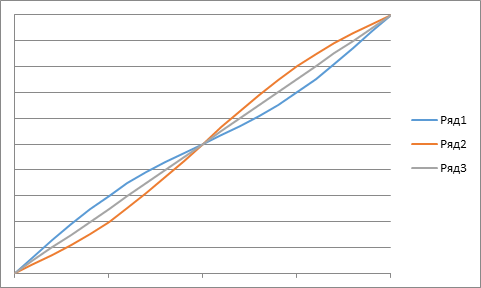
Series1 - μ < 0
Series2 - μ > 0
Series3 - μ = 0
Discussion
In computer simulation, as a result of optimization of the standard PRSG, the value of μ is obtained by the above-described scheme, which provides a better approximation of π and thus a higher quality of the implementation with the standard function Math.GetRandomNumber after its correction. We note that in this case the parameter μ turned out to be greater than zero, i.e. the configuration of the function (4) corresponds to the red curve in Fig. 2. The average estimations obtained in the Monte Carlo model with optimized PRSG are presented in the diagram below, together with the estimation for the standard PRSG from the diagram in Fig. 2.
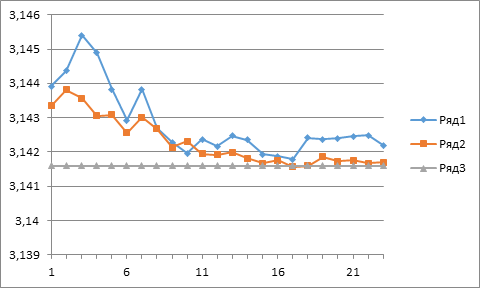
Series1 – Before optimization
Series2 – After optimization
Series3 – Level of π
From this diagram, it can be seen that the Monte Carlo model with an optimized PRSG generator has a smaller dispersion and improves the approximation of the π (according to the results – up to the third decimal place).
Conclusion
Above, we considered the formulation of a problem in which the Monte Carlo methods are used to evaluate the quality PRSG with the uniform distribution law. In the framework of this problem formulation, a π-Test with a simple implementation considered above is proposed that can be used to verify the quality of any PRSG with the uniform distribution law. Therefore, this test should be a good supplement to existing testing methods. In addition, it has been shown that this π-Test can be successfully used to optimize PRSG with the uniform distribution law. Performance of the proposed approach is confirmed by the results of computer simulation.
References
- Intel Digital Random Number Generator (DRNG): Software Implementation Guide. [Электронный ресурс] https://software.intel.com/en-us/articles/intel-digital-random-number-generator-drng-software-implementation-guide
- Soto Juan. Statistical Testing of Random Number Generators. Proceedings of the 22nd National Information Systems Security Conference. – 10/99
- James E. Gentle. Random Number Generation and Monte Carlo Methods. – Springer Science & Business Media. 2013: 247 с.
- Бронштейн И.Н., Семендяев К. А. Справочник по математике для инженеров и учащихся втузов – М.: Изд-во. Наука. 1967: 608 с.
- Stephen K. Park and Keith W. Miller (1988). Random Number Generators: Good Ones Are Hard To Find. Communications of the ACM 31 (10): 1192 - 1201[4]
- Small Basic – The Programmer's Guide. [Электронный ресурс]. https://www.i-programmer.info/programming/other-languages/5196-small-basic-the-programmers-guide.html
- Сучилин В.А. Вычислительная схема квадратичной оптимизации. Изв. ВУЗов. «Радиоэлектроника», Вып. 6, 1990.
All articles of author «Сучилин Владимир Александрович»
© If you have found a violation of copyrights please notify us immediately by e-mail.