 View this article in Russian
Introduction
The failure rate function is considered as one of the most significant reliability indicators, and this is due to its notable properties [1]. The failure rate has a good visualization and it affords to define reliability by means of a few values. Besides, the necessary failure rate parameters may be generally derived from the empirical data. Conventionally, the failure rate function is represented by the bathtub-shaped characteristic with three segments as shown in the Fig. 1 below [2].

Fig. 1 – The bathtub-shaped failure rate function
The legend of the Fig. 1 is following:
Segment I relates to the development period of the facility and generally has a higher failure rate due to faults at the start of production.
Segment II with a nearly constant failure rate corresponds to the main operating period of the facility.
Segment III is considered as the period of aging and therefore increasing of the failures associated with long-term using of the facility.
To date the modeling of the bathtub-shaped failure rate function mainly employs approach based on the Weibull failure rate distribution with specific parameters for each individual segment i.e. segmented approach [2, p. 8]. However, this approach has a number of disadvantages. The purpose of this article is to propose a functional presentation that would more effectively suit to the bathtub-shaped failure rate function using continuously a two-three parameters for all the segments. We define this as non-segmented modeling as opposed to the conventional segmented approach [3].
Segmented approach
The realization of the segmented approach is generally connected with the Weibull distribution and presented with the expression [3]:
 (1)
(1)
where:
T – life cycle time
α – the Poisson parameter
β1 < 1 (in view of Segment I)
β2 = 1 (in view of Segment II)
β3 > 1 (in view of Segment III).
As will be shown below, such segmented modeling, which has a satisfactory performance on the Segment I, suits insufficient to the bathtub-shaped characteristic on two other segments.
Non-segmented approach
To improve the disadvantage mentioned above, consider the function using two components P(t) and W(t), which are Poisson and Weibull distribution function accordingly:
S(t) = β-1P(t) – (T ln ln (1– W(t))-1)-1 , 0 ≤ t < T (2)
Expression (2) may be written in a more practical manner as
S(t) = β-1e-δt – (β·T ln t/T)-1 , 0 ≤ t < T (3)
where δ is the Poisson parameter.
Concerning the properties of this functional presentation, the function (3) is positive and regular. Besides, it has a special zero point:
S(0) = β-1 (4)
which e.g. can be comfortably used for the parameter β evaluation.
According to expression (3), the Poisson component dominates on the Segment I, while the Weibull component has there a negligible effect. On the other hand, the Weibull component dominates on the Segment III, while the Poisson component has there a negligible effect. Finally, on the Segment II, the components are complementing each other, and that leads to a rather steady characteristic of the Segment II. As required, the function (3) uses an additional matching item γ which may be evaluated as the failure rate average value on the Segment II.
Numerical comparison
Below, to compare the efficiency of functional presentations (1) and (3) it will be used empirical data with a specific life cycle T = 100 e.g. months [4, p. 54]. The results of numerical comparison are shown on the diagram below.
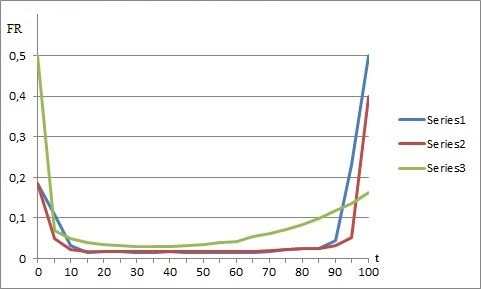
Fig. 2 – Comparison of the failure rate presentations
Series1 – Empirical data,
Series2 – Non-segmented approach
Series3 – Segmented approach
Table 1– Numerical data to the Fig. 2
|
t |
Series1 |
Series2 |
Series3 |
t |
Series1 |
Series2 |
Series3 |
|
5 |
0.1092 |
0.0498 |
0.0683 |
55 |
0.0151 |
0.0166 |
0.0351 |
|
10 |
0.0316 |
0.0221 |
0.0498 |
60 |
0.0151 |
0.0166 |
0.0387 |
|
15 |
0.0154 |
0.0166 |
0.0406 |
65 |
0.0155 |
0.0167 |
0.0424 |
|
20 |
0.0174 |
0.0166 |
0.0351 |
70 |
0.0159 |
0.0185 |
0.0535 |
|
25 |
0.0177 |
0.0166 |
0.0314 |
75 |
0.0184 |
0.0203 |
0.0609 |
|
30 |
0.0152 |
0.0166 |
0.0295 |
80 |
0.0225 |
0.0221 |
0.0721 |
|
35 |
0.0159 |
0.0166 |
0.0295 |
85 |
0.0239 |
0.0239 |
0.0849 |
|
40 |
0.0164 |
0.0166 |
0.0296 |
90 |
0.0248 |
0.0258 |
0.0978 |
|
45 |
0.0153 |
0.0166 |
0.0314 |
95 |
0.0441 |
0.0314 |
0.1181 |
The characteristic of segmented approach in the Fig. 2 uses α = 0.01. Besides, it is supposed that β1 = 0.5, β2 = 1.0 and β3 = 4. In turn, the characteristic of non-segmented approach in the Fig. 2 uses δ = 0.27, γ = 0.0161 and β = 5.9.
Another interesting aspect is the failure rate characteristic’s dependency on β which is a key parameter of the Weibull distribution [3]. The comparison results of modeling for the bathtub-shaped failure rate function using both functional presentations are shown in the Fig. 3 (the function (1)) and in the Fig. 4 (the function (3)).
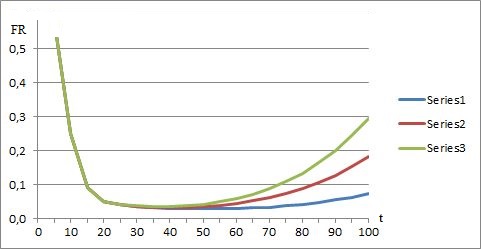
Fig. 3 – Segmented failure rate functional presentation
Series1 – with β = 2.5
Series2 – with β = 7.5
Series3 – with β = 12.5
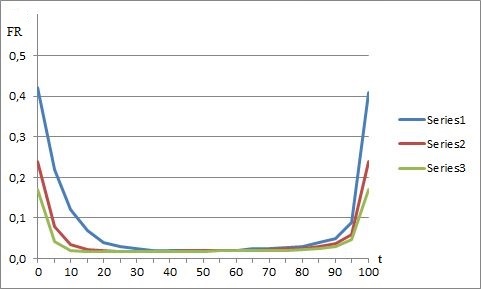
Fig. 4 – Non-segmented failure rate functional presentation
Series1 – with β = 2.5
Series2 – with β = 4.5
Series3 – with β = 6.5
Thus, as opposed to segmented approach, the non-segmented modeling outlined above distinctly preserves the bathtub-shape configuration by all values β.
Conclusions
The numerical comparison presented above makes it clear that the non-segmented modeling of the bathtub-shaped failure rate function is not only more effective from the point of view matching the bathtub-shape characteristic, but besides significantly better suits to the empirical data. At that as components the Poisson and Weibull distribution functions are used with their parameters which may be easily derived from the specific points of failure rate characteristic or evaluated by means of statistical estimation [5]. The non-segmented modeling proposed should improve the performance of reliability analyzes and its applications.
References
- Richard E. Barlow, Frank Proschan. Statistical Theory of Reliability and Life Testing. Holt, Rinehart & Winston Inc., N. Y.: 1975. 290 p.
- John Jay. Modern Approaches to Discrete, Integrated Component and Facility Reliability Engineering. Xlibris. Reprint edition, 2016. 134 p.
- Mudholkar, D.K. Snvastava, “Exponentiated Weibull family for analyzing bathtub failure rate data”, IEEE Trans. Reliability, vol. 42, no. 2.
- Percy H. Hill. The Science of Engineering Design. Holt, Rinehart & Winston Inc., N. Y.: 1970. 372 p.
- Tikhov M.S. “Statistical estimation on the basis of interval-censored data”, Journal of Math. Sciences, vol. 119, no. 3.