Studies as a part of this research work were conducted in:
-
Research and production base, “La Lik” Ltd., International Center of Revitalization and Rejuvenation, (Russia).
-
National Research Nuclear University (MEPhI), (Russia).
-
Federal State Institution, A.I. Burnazyan Federal Medical and Biophysical Center (FSI FMBC) (former State Research Center, Institute of Biophysics), (Russia).
-
This work underwent the examination to the point of spectrometry section and got the expert judgement of the National Research Centre (NRC “Kurchatov Institute”), (Russia).
This work provides a definition of the supraphysiological mechanism of ageing. That is, what launches the mechanism of physiological ageing.
In the course of observations and studies, particles emitted by people were detected under controllable conditions. The wavelength of the particles was 7.87008 × 10⁻³ (nm); the wave frequency was 3.808 × 10¹⁹ (Hz); the particle mass was 2.809247 × 10⁻³¹ (kg).
The fact that people emit such particles is closely related to the state of people’s health and their lifetime.
A conclusion was made that a man is an open quantum and biological system interacting with the environment on a regular basis and emitting an electromagnetic wave in the form of gamma quanta. Mineral substances deposited in the bone mass enable people to generate the electromagnetic wave.
Sections:
Introduction – defining the supraphysiological mechanism of ageing as well as postulating the neglected ageing formula and substantiating it.
-
Proving the people’s ability to emit their own electromagnetic wave.
-
Proving the mutual relation between the human age and percentage of the bone tissue mineralization.
-
Evident statistics for the people’s ability to emit their own electromagnetic wave depending on the age.
-
Distribution of the radiation power by the human body components.
-
Visual experiment demonstrating changes in the human photon radiation.
-
Historic documents and hypotheses about the experimental conditions making it possible to record particles with the mass being less or equal to that of electron.
-
Experiment demonstrating changes in the people’s specific activity in the gamma spectrum and calculation of physical parameters of particles emitted by people.
-
Interaction between gamma radiation and substance.
-
Conclusion.
Supraphysiological Mechanism of Ageing
The supraphysiological mechanism of ageing is not related to the physiology of biological senility and does not explain it. The supraphysiological mechanism of ageing explains why physiological senility develops, i.e. why we get older.
The term ‘supraphysiological mechanism’ means ‘being above physiology’. People begin getting older supraphysiologically: women at the age of 20-21 on average, and men at the age of 23-25. Then the latent fading process begins. This stage lasts till 38-45 in women and 45-51 in men on average. Then physiological ageing processes begin, and a lot has already been written about them. One disease further results in another, and we face the outcome on an everyday basis.
A man emits an electromagnetic wave in the range of gamma quanta in a definite period with the cycle reproducible on a daily basis. Gamma quanta are characterized by high energy, so it takes physical efforts to emit an electromagnetic wave in this spectrum. Such physical efforts required for intrinsic emission are taken at the expense of human internal resources, i.e. at the expense of stored inorganic substances distributed in our body and deposited mainly in the bone tissue. Since inorganic resources in our body are limited and hardly reproducible, the mass of inorganic substances reaches the critical level in the course of time. When the critical mass of inorganic substances in our body is achieved, the physiological ageing process is launched.
1. A man emits a flow of gamma quanta at the expense of inorganic compounds distributed in our body, and the bone tissue being the donor of inorganic compounds plays an active part in this process.
2. The latent fading process begins developing as soon as the bone tissue is formed (women at the age of 21 and men at the age of 25). When the critical mass of inorganic substances in our body is achieved, the latent fading period becomes a physiological ageing process.
We know from physics that organic compounds and Н2О cannot serve as sources of gamma quanta. Water makes up 60% of the human body mass, and the remaining 40% of the mass are distributed between structural components and inorganic substances.
– 1 -
Can a man be a source of electromagnetic waves emitted with the use of his strategic reserve? There was an experiment under controllable conditions and involving calibrated data confirming that he actually can do this.
If we repeat the Rutherford experiment with a man inside a lead chamber, we will observe a flow of beta quanta. Radioactive nuclides of our body are the source: potassium – 40 and carbon – 14.
40K, relative atomic weight of potassium taking into account the occurrence of its isotopes, is 39.0983, and its half-life t1/2 = 1.28·109 years. A man with the weight of 70 kg contains about 0.2% of potassium (140 g or 2.47·1020 atoms).
“There are two ways 40K disintegrates: in 11% of cases, it disintegrates by electron capture (or K-capture by the number of the shell where the electron capture takes place): 40K + е → 40Ar. The remaining 89% of 40K (1,2·1011 atoms per year) disintegrate along with beta radiation: 40K → 40Ca + е. The energy of these beta particles is 1.314 MeV = 1.314·106 eV. As is generally known, 1 eV is equal to 96,500 J/mol or 96,500/6·1023 = 1.6·10–19 J per one particle. Therefore, the energy of all beta particles emitted by a human organism per year is 1.314·106×1.6·10–19 × 1.2×1011 = 0.025 J or 0.36 mSv.
There are about 14 kg of carbon in a man with the weight of 70 kg. Thus, 15.3·103 × 70 = 1.07·106 atoms disintegrate per minute and 5.63·1011 atoms of 14C disintegrate in a human organism per year. Just like potassium-40, carbon-14 goes through beta disintegration with much lower energy – only 0.156 MeV = 0.156·106 eV. Therefore, the total energy of all beta particles is 0.156·106×1.6·10–19 × 5.63·1011 = 0.014 J or 0.2 mSv” [1]. The total radiation level of 40К and 14С is 0.36 + 0.2 = 0.56 mSv per year or 0.06 µSv per hour.
In this experiment, the total value of 0.06 µSv per hour is accepted as the first calibration value.
The background level in the premises where the observation was carried out was taken as the second calibration value. The premises were at a great distance from megacities. The premises had concrete walls with the thickness of 25 cm, shielded roof, and floor with a concrete blinding coat with the thickness of 15 cm. The premises had no wiring or windows. The outer walls were rounded with soil up to the height of 50 centimeters. The background level was monitored for 14 days, and measurements were taken every 15 minutes.
The background level in the premises was taken as the second calibration value – 0.08 µSv per hour.
The outdoor background level in the area was taken as the third calibration value. The data varied from 0.15 to 0.18 µSv per hour in winter.
Fifteen people took part in the observation. Fifteen men aged 28-34 and having no pathologies underwent a prior examination for radionuclide radiation dose using the Human Radiation Spectrometry Method. The results for all of them were negative.
In the course of observations, the men under examination were drinking water and eating light vegetable food, which underwent a preliminary radiation control. Measurements were taken every 15 minutes. Every man was observed for 24 hours.
As of the date of the experiment, the terrestrial magnetic field was quiet. Activity of the Sun was low.
Using the term ‘emission in the gamma quanta spectrum’, we exclude the term ‘radiation’. The threshold safety dose for people is 0.3 µSv per hour. In the course of our observations, any changes in recorded parameters were within the range of safe values.
Figure 1.
Human emission of gamma quanta according to the circadian (daily) cycle.

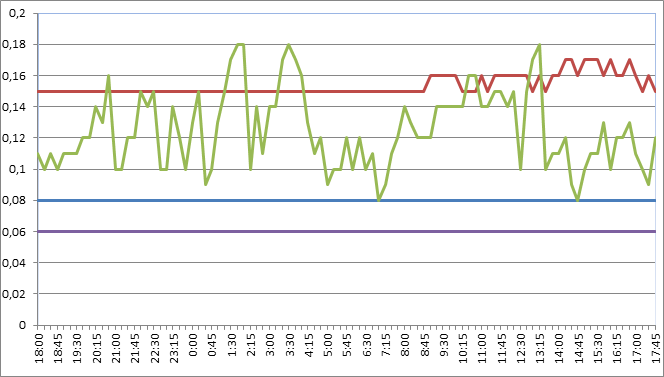
The horizontal axis is time.
The vertical axis is the emission level (µSv per hour).
The blue line symbolizes the background level in the premises.
The red line symbolizes the background level in the area.
The green line symbolizes the human emission threshold value.
The violet line means the emission of 40К and 14С.
The terrestrial magnetic field was quiet.
Activity of the Sun was low.
The following periods of time were selected for more detailed examination of gamma quanta amplitudes according to the circadian cycle: one hour of night-time activity (01:00-02:00) and one hour of daytime passivity (13:15-14:15). Measurements were taken and recorded every two minutes.
The following diagrams are given below for comparative purposes.
Figure 2.
Readings are recorded every two minutes during the active period.

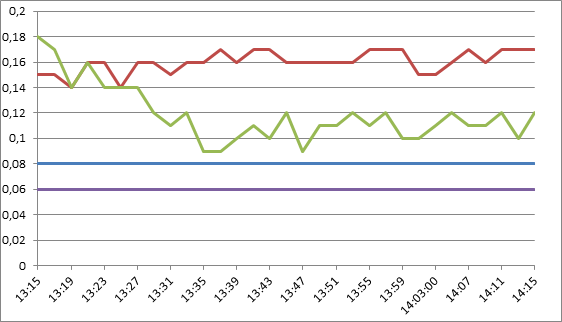
The horizontal axis is time.
The vertical axis is the emission level (µSv per hour).
The blue line symbolizes the background level in the premises.
The red line symbolizes the background level in the area.
The green line symbolizes the human emission threshold value.
The violet line means the emission of 40К and 14С.
Figure 3.
Readings are recorded every two minutes during the tranquil period.
Specifications of measurement equipment.
Range of ambient equivalent dosage power H×(10) µSv per hour
0.05-999.0
Power range for the recorded gamma emission MeV
0.1-1.25
The following conclusion can be made based on the experiment described above, which was carried out under controllable conditions and involved calibration data: The improvised Rutherford chamber (human adapted) provided a minimum exterior effect on people inside the chamber, and the man was a source of electromagnetic waves in the gamma spectrum.
The threshold emission amplitude can be different in different people: ± 0.02 µSv per hour.
The time shift is ± 2 – 38 minutes.
The peak emissions of gamma quanta being evidently higher than the area background radiation level were observed four times a day: at night: 01:00-02:00, 03:00-03:30; at the daytime: 12:30-13:15; in the evening: 20:30-21:15. There is the fifth peak at 10:45-11:30. It was identified but its statistical reliability is very low because activity of the Sun is high at that time, and the peak amplitude can be due to the increased natural radiation background.
When we conducted repeated measurements two months later, closer to the solstice in spring, a time shift was observed: there was a shift in the emission peaks as they were observed 30-60 minutes earlier than before. It is related to the fact that the night becomes shorter and the day becomes longer. Emission peak times can also be related to the latitude.
The final conclusion for the first experiment is as follows. A man is a source of electromagnetic waves in the gamma spectrum. The threshold emission power and its amplitude are directly related to the circadian (daily) cycle and time of year. Therefore, they are related to the Earth’s revolution around the Sun.
There is one note to the instrumental method: the instrumental method error is ± 25-30%.
Tools applied make it possible to measure gamma quanta in the SI units – in sieverts. Sievert is a unit defining the biological harm caused by radiation to one kilogram of biological tissue. In other words, measurements were taken not on the basis of direct radiation from the subject under examination but the radiation value of gamma quanta per one kg of biological tissue. Since there were only men in the improvised Rutherford chamber and exterior effects on these people were minimized, we think that it was the man who generated electromagnetic waves.
- 2 -
Is the bone tissue the place where inorganic substances are deposited? And is there any relationship between the human age and amount of inorganic elements?
It is known from literature sources that bone tissue is a special type of connective tissue taking part in the water and salt exchange. The chemical composition of the bone tissue is as follows: water: about 50%, fats: 15.75%, other organic substances: 12.4%, inorganic substances: 21.85%. Ossein (an organic substance) makes bones elastic and gives them their shape. Inorganic substances making up 21.85% are distributed as follows: calcium salts (87%), magnesium phosphate (2%), calcium carbonate (10%), calcium fluoride, sodium carbonate and sodium chloride (1%).
“As people grow older, the share of inorganic substances in the bone tissue grows, and the growing bones become harder. When growth stops (usually at the age of 20-25), cartilages are completely replaced with the bone tissue. When people are over 40, so-called involutive processes take place in bone tissues. The amount of bone substance reduces with age, and the share of organic substances in the bone tissue declines as well. Moreover, the content of water in the bone tissue is also reduced as if it dries out. Bones become breakable and fragile” [2].
In other words, the ratio between organic and inorganic substances changes, and the latter prevail.
Table No. 1 [3].
Chemical composition of the bone tissue and teeth (mass percent) as of 2004.
No. Component
Bone tissue
Teeth tissue (dentine)
1 Са
34.8
35.1
2 PO43-
15.2
16.9
3 Na
0.9
0.6
4 Mg
0.72
1.23
5 K
0.03
0.05
6 CO33-
7.4
5.6
7 F
0.03
0.06
8 Cl
0.13
0.01
9 H2O
10
10
10 Inorganic component
65
70
11 Organic component
25
20
Table No. 2 [4].
Content of inorganic compositions in teeth as of 1975.
No.
Element
Element content in teeth (mg/kg, %)
1
H+C+O+N
23 – 26%
2
F
2,435
3
Mg
6,956.5
4
P
13.48%
5
Ca
28.26%
Information about the bone tissue is given as of the late 20th century.
Functions of the bone tissue are defined as follows: “Bones play a number of important roles in the organism: protection against injuries, movement and creation of calcium depot” [5].
In up-to-date studies, there are other data on the content of inorganic substances in the bone tissue and direct ratio between the concentration of inorganic substances and man’s age.
Such studies were conducted on the basis of the Chief State Center of Medical and Forensic Examinations, Russian Defense Ministry. Results of a study of the element composition of human bone tissues with the use of the laser mass spectrometry method were first published in 2007-2008. This method makes it possible to detect approximately 20 elements at a time, which are located in the bone tissue, and, first of all, elements with small atomic norms. To diagnose medical and biological signs of men with the use of this method, it is enough to conduct a quantitative analysis of elements found in the bone tissue at the sensitivity level of 1 µg/g.
“The elemental analysis of samples in the group (fresh bone tissue) was carried out by the laser mass spectrometry (LMS) method at VNIIIMT (All-Russian Scientific, Research and Testing Institute for Medical Devices), Ministry of Health of the Russian Federation (Department of Toxicology Tests and Examinations of Materials and Medical Devices) using the laser double-focusing mass spectrometer (EMAL-2). The well-known method of reference-free analysis of biological samples (native samples) dried out to the constant mass was used.
Table 3.
Ranges of element concentrations in the cortical tissue detected in all of the samples under examination by the laser mass spectrometry method (‘fresh’ bone tissue).
No. Element
Bottom and upper levels of the element content in dry bone (mass percentage)
Bottom and upper levels of the element content in dry bone (µg/g, %)
Fluctuation in the element concentration value (times) (upper limit / bottom limit)
1. H+C+O+N
32.00 – 59.00
32.00 – 59.00 %
1.84
2. F
0.02 – 0.40
200 – 4,000 µg/g
20
3. Na
0.34 – 3.60
3,400 – 36,000 µg/g
10.6
4. Mg
0.0466 – 1.90
466 – 19,000 µg/g
40
5. Al
0.001 – 0.04
10 – 400 µg/g
40
6. Si
0.004 – 0.40
40 – 4,000 µg/g
100
7. P
5.50 – 6.5
5.5 -16.5 %
3
8. S
0.05 – 1.00
500 – 10,000 µg/g
20
9. Cl
0.01 – 0.50
100 – 5,000 µg/g
50
10. K
0.10 – 2.50
1000 – 25,000 µg/g
25
11. Ca
25.00 – 40.00
25.00 – 40.00 %
1.6
12. Fe
0.001 – 0.04
10 – 400 µg/g
40
13. Cu
0.0001 – 0.0055
1 – 55 µg/g
55
14. Zn
0.001 – 0.06
10 – 600 µg/g
60
15. Sr
0.01 – 0.2
100 – 2,000 µg/g
20
16. Pb
0.0001 – 0.0066
1 – 66 µg/g
66
Elemental analysis of samples in the group (teeth of alive people) was carried out by the high-resolution mass spectrometry method with the sample ionization in inductively coupled plasma (ICP MS) at the Institute of Mineralogy, Geochemistry and Crystal Chemistry of Rare Elements (IMGRE) using the device ELAN 6100 DRC made by Perkin Elmer. Spectrum interpretation and content determination procedures are completely automated.
The following elements were detected in the teeth samples using the ICP MS method: Li, Be, Na, Mg, Al, K, Ca, Sc, Ti, V, Cr,Mn, Fe, Co, Ni, Cu, Zn, Ga, As, Se, Rb, Sr, Y, Zr, Nb, Mo, Rh, Pd, Ag, Cd, Sn, Sb, Te, Cs, Ba, La, Ce, Pr, Nd, Sm, Eu, Gd, Tb, Dy, Ho, Er, Tm, Yb, Lu, Hf, Ta, W, Re, Ir, Pt, Au, Hg, Tl, Pb, Bi, Th and U (62 elements in total).
Table 4.
Ranges of element concentrations in teeth detected in all of the samples under examination by the ICP MS method.
No.
Element
Element detection limit
(µg/g, %)
Bottom and upper levels of the element content in teeth
(µg/g, ng/g, %)
Fluctuations in the element concentrations
(times)
1
2
3
4
5
1.
Na
0.1
1,931-17,646 µg/g
9.14
2.
Mg
0.1
1716-12199 µg/g
7.11
3.
Al
0.1
0.43-359 µg/g
835.0
4.
K
0.1
129-794 µg/g
6.15
5.
Sc
0.02
0.01*-0.21 µg/g
21
6.
Ti
0.1
1-15 µg/g
15
7.
V
0.1
0.04*-0.46 µg/g
10.75
8.
Cr
0.05
0.05-4.0 µg/g
80
9.
Mn
0.02
0.3-3.57 µg/g
11.9
10.
Co
0.01
0.2-6.81 µg/g
34.05
11.
Ni
0.01
0.25-13.2 µg/g
52.8
12.
Cu
0.005
0.22-1.55 µg/g
7.05
13.
Zn
0.01
73-2,878 µg/g
39.42
14.
Ga
0.001
0.3-0.74 µg/g
2.47
15.
Rb
0.0005
0.114-0.994 µg/g
8.72
16.
Sr
0.0005
2.67-187 µg/g
70
17.
Y
0.0002
1.18-100 ng/g
85.0
18.
Zr
0.0005
0.5-220 ng/g
440
19.
Nb
0.001
1-130 ng/g
130
20.
Mo
0.0005
0.029*-25.0 µg/g
862
21.
Cd
0.0005
0.5-75.4 ng/g
150.8
22.
Cs
0.0002
0.2-20 ng/g
100
23.
Ba
0.0005
2.6-105 µg/g
42
24.
La
0.0002
1-284 ng/g
284
25.
Ce
0.0002
1-200 ng/g
200
26.
Pr
0.0002
0.4-58.1 ng/g
116.2
27.
Nd
0.0002
1-199 ng/g
199
28.
Sm
0.0002
0.36-33.46 ng/g
92.94
29.
Eu
0.0002
0.18-8.84 ng/g
49.1
30.
Gd
0.0002
0.2-22.6 ng/g
113.0
31.
Tb
0.0002
0.4-44.7 ng/g
11.75
32.
Dy
0.0002
0.27-17.09 ng/g
63.3
33.
Ho
0.0002
0.1-3.318 ng/g
33.18
34.
Er
0.0002
0.1-9.08 ng/g
90.8
35.
Tm
0.0002
0.1-2.705 ng/g
27.05
36.
Yb
0.0002
0.1-9.37 ng/g
93.7
37.
Lu
0.0002
0.1-13.77 ng/g
137.7
38.
Hf
0.0002
0.1-15.3 ng/g
153
39.
Ta
0.0002
0.1-39.17 ng/g
391
40.
W
0.005
5-513 ng/g
102.6
41.
Re
0.00015
0.031*-30.03 ng/g
968
42.
Ir
0.0002
0.044*-0.415 ng/g
9.43
43.
Pt
0.0003
0.4-77.64 ng/g
194.1
44.
Au
0.0008
0.23*-3.23 ng/g
14.04
45
Tl
0.0002
0.4-38.59 ng/g
96.48
46
Pb
0.001
0.24-12.76 µg/g
53.17
47
Bi
0.0002
0.001-38.2 µg/g
48
Th
0.0002
0.2-28.9 ng/g
145
49
U
0.0002
0.5-23.5 ng/g
47
* The bottom level of the element concentrations lies below the detection limit.
Based on the elemental composition, it is possible to provide direct (complex) assessment of subjects by their principal medical and biological features (such as species, sex, age, height, territory of residence, natural habitat, local environment conditions, some diseases, prescription of burying, etc.) based on the available material. Such assessment is made based on the results of bone tissue elemental composition analysis with the use of computer technologies. It can help reveal a considerable list of human signs for identifying the man.
For Na, P, Si, Ca and light elements (H+C+N+O), it was possible to relate bimodality to sex, age and body height of the study subjects.
Elements with high coupling coefficients are not subjected to Gaussian distribution and depend on each other. This means that the content of some chemical elements can be forecasted with a high degree of probability according to other ones, and such ratios can be described in the form of equations.
We applied the multiple regression method to determine the relations.
H…= 101.8 – 0.11P – 0.94Ca – 0.1S, (
 =0.966)
P = -0.69 + 0.16Na + 0.11Si + 0.96Ca, (
 =0.871)
Ca = 5.44 – 0.82H… – 0.12Na – 0.24Si, (
 =0.968),
where R2 is the square of the multiple regression coefficient.
Diagnosing sex, age and body length. For the purposes of defining the character of the relationship between the concentrations of elements and signs under examination, the discriminant analysis methods were used.
To separate men aged over 40 from men younger than 40, it is possible to use the discriminant function:
y = – 24,269 + 490 Light elements (H+C+O+N) + 2,693 Na + 25 Si + 743 P+2,691 Ca
The decision rule is as follows: y > 0 – the subject is younger than 40; y < 0 – the subject is older than 40.
The probability of correct distribution of men was 0.82.
The following two discriminant functions are used for normalized data for the purposes of more gradual assessment of age-related groups:
Y1= 4.97 – 1.304Na + 2.282Si (57-82 years)
Y2= 0.05 + 8.169Na – 7.951Si (22-39 years)
And the following decision rules apply: Y1 > 0 and Y2 > 0 – older than 57; Y1 < 0 and Y2 < 0 – aged 22-39; Y1 < 0 and Y2 > 0 – aged 39-57.
The groups of elements essential for defining different medical and biological signs were established. Thus, sex, age and body length can be determined based on the bone tissue concentration of (H+C+O+N), Na, Si, P, Ca and S; the territory of origin (its geochemical aspect) can be diagnosed using the data on the concentration of residual elements in teeth” [6;7].
Let us summarize. A reasonable conclusion follows from present-day data on bone tissue studies: the amount of inorganic compositions distributed in the bone tissue steadily declines as the man becomes older. The concentration of inorganic elements begins falling down at the age of 21-25, i.e. from the moment of the bone tissue formation. A slow reduction in the concentration of elements takes place by the age of 40. Then an evident regression is observed.
For this function, y = – 24,269 + 490 Light elements (H+C+O+N) + 2,693 Na + 25 Si + 743P+2,691Ca, the rule y > 0, which is related to the age younger than 40, can be achieved if the bone tissue contains quite a big share of inorganic compounds. The rule y < 0, which is related to the age over 40, can be obtained in case of a low content of inorganic substances in the bone tissue.
People do not spend this amount of different elements on maintaining their vital functions on an everyday basis. The food people consume is enough for this. It is water insoluble elements, which are quite inert in the human internal environment, that serve as the strategic reserve for the people’s ability to generate their own electromagnetic waves.
The biological component of a man and Н2О, which makes up 60% of the human body mass, is less adaptive and can be regenerated fast. Cells can actually regenerate. It takes 150 days for blood cells to be regenerated, skin cells need 14 days, intestine epithelial cells can be regenerated every five days, and it takes a year for hepatic cells to be regenerated. The bone tissue is regenerated in ten years.
In view of the latest medical observations, the dynamics of the mineral composition of the bone tissue is as follows:
“Women aged 21-80. The Percentage of Minerals (PM) at the age of 51-55 reduces in the trunk, ribs, backbone and pelvic bones. At the age of 56-60, the PM reduces substantially in ribs, pelvic bones and trunk. The PM is practically unchanged in the cranial bones and limbs. At the age of 66-70, the PM reduces most substantially in ribs and pelvic bones. At 76-80, the most substantial loss of minerals takes place in the backbone. At the age of 81-85, the minimum mass of minerals is observed in ribs, backbone, pelvic bones and lower limbs.
Men aged 21-85. The first signs of demineralization become evident in the pelvic bones at 50; the further reduction in the content of minerals was observed at the age of 55. At 56-60, the loss of mineral was observed in ribs. The third demineralized segment – the trunk – was observed at 61-65. At the age of 66-70, the upper and lower limbs are affected, and backbone and cranial bones are affected at the age of 71-75. The greatest extent of demineralization was observed in pelvic bones, ribs, trunk and upper limbs at 76-80″ [8].
“The bone substance loss is considered to occur after 30 in people of both sexes. The mineral density loss rate in men is 0.3-0.5% per annum, and this index remains the same for their life term. In women, the process of reduction in the bone mass density is more complicated. Prior to the mesopause, it flows in parallel with men and achieves 0.7-1.3% per annum. After the mesopause, the bone mass loss is accelerated to reach 2-3% a year for the first 5-10 years, and then the bone mass density is further reduced by 1% per year on average for ten years after the mesopause” [9].
“Biochemical markers make it possible to diagnose signs of the bone mass loss at an early stage. There are two groups of biochemical markers: bone formation and resorption markers” [10].
Bone metabolism is characterized by two multidirectional processes: formation of new bone tissue by means of osteoblasts and destruction (resorption) of old bones by osteoclasts, which are mutually related and determine the bone mass.
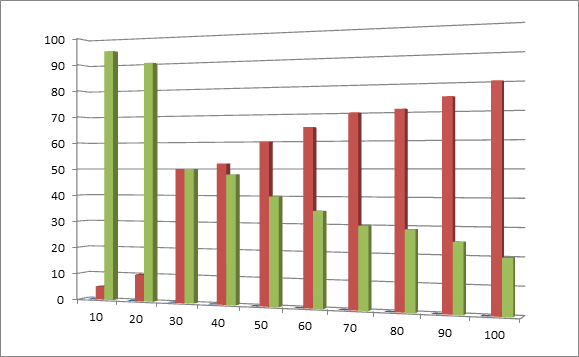
Based on the medical statistics given above, we can give an evident example of the total percentage ratio between the bone formation marker and bone tissue disintegration marker depending on the age.
Figure 4.
General ratio (in %) between the bone formation marker and bone tissue disintegration marker depending on the age.
The horizontal axis is the man’s age in years.
The vertical axis is percentage.
The green color shows the bone formation marker.
The red color shows the bone tissue disintegration marker.
- 3 -
The following observations provide an insight into how the people’s ability to generate electromagnetic waves reduces with age. The observations were conducted in a shielded room without any wiring to exclude any effect of any induced interference. We measured the background in the room, which was taken as the baseline level.
The number of participants in the observations was 55. The age distribution was as follows:
-
Age 4-14 years: 9 people
-
Age 18-26 years: 15 people
-
Age 34-40 years: 14 people
-
Age 45-50 years: 6 people
-
Age 65-78 years: 11 people
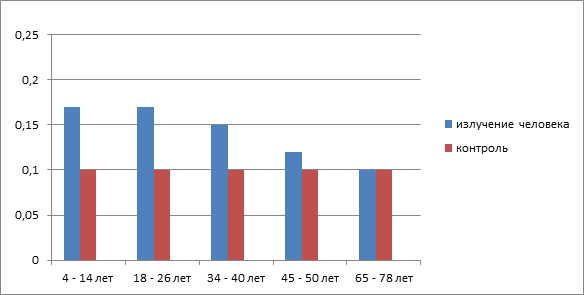
The background in a special room making up 0.09-0.10 µSv per hour was taken as the control value.
Individual measurements of the participants were taken.
In 95% of the cases, the distribution was as follows:
-
Age 4-14 years: 0.14 – 0.17 µSv per hour
-
Age 18-26 years: 0.12 – 0.17 µSv per hour
-
Age 34-40 years: 0.10 – 0.15 µSv per hour
-
Age 45-40 years: 0.08 – 0.12 µSv per hour
-
Age 65-78 years: 0.08 – 0.10 µSv per hour
We can see that the more advanced in years a person is, the smaller his or her individual background is” [11].
Figure 5.
Human background data depending on the age.


– 4 –
In the course of human life, the maximum pressure falls on the head when electromagnetic waves are generated. There are few distributed inorganic substances in our heads.
Table No. 5 [12; 13].
Reference data on the content of inorganic compositions in the brains.
| No. |
Element |
Body part |
Content |
| 1 |
Zr |
Brain |
0.12 mg/kg |
| 2 |
B |
Brain |
1.1 mg/kg |
| 3 |
Сu |
Brain |
60 mg |
| 4 |
Ag |
Brain |
0.03 mg |
| 5 |
Zn |
Brain |
35.52 mg |
| 6 |
Ti |
Brain |
0.0017 mg per 100 g of the weight |
| 7 |
W |
Brain |
284.4 µg % |
| 8 |
Сr |
Pituitary gland |
6×10⁻⁴ mg/kg |
| 9 |
Mn |
Pituitary gland |
256-288 µg per 100 g of the weight |
Teeth being a storehouse for inorganic substances compensate for the loss (see Table 4). All this is not sufficient anyway because most electromagnetic waves are observed in the area of our head. The maximum spectrum of emission falls on the head (parietal and cervical area) where there is the epiphysis with the brain sand (acervulus cerebralis), hypothalamus and pituitary gland. Since the load on such a small ‘transmitter’ is quite great, its wear and tear occurs faster. How do we notice that we are getting older? It begins with our head. We get gray hair, our sight deteriorates and we have to wear glasses, there are wrinkles on our faces and we have artificial teeth instead of natural ones. This is the result.
Then there is a dysfunction in how the pituitary gland and hypothalamus work, which results in hormonal imbalance disorganizing the functions of the entire organism. Frolkis V.V. [14] wrote in his work: “The genetic cell apparatus is under complex hormonal control. It… can change gene regulatory mechanisms. When we become older, changes in the endocrines function and blood concentration of hormones takes place, and this results in misbalance of the genetic apparatus. The glands are under control of a cranial structure – hypothalamus. In advanced age, hypothalamic control over activities of the cell genetic apparatus becomes weaker” [15].
These studies were done to analyze the mechanism of action of the substance «Star dust» (SSH&H), introduced in the State Register as a food supplement and as an additional source of magnesium, iron, zinc, manganese, copper and chromium. This substance had a specific characteristic – it was statistically recorded that by ingesting it orally there were significant changes in the specific activity of man in the spectrum of gamma photon, which coincided for strength and facts in one second with the valuesobserved in the daily natural cycle. This specific characteristic allowed to perform additional experiments.
Under the controlled conditions of dosimetry monitoring, there was an experiment aimed at studying changes in the specific activity of people in the gamma spectrum distributed by human body parts in case of peroral administration of «Star dust» (SSH&H).
The substance administered to people, «Star dust» (SSH&H), underwent radioactivity examinations and passed radionuclide tests at the National Research Nuclear University (MEPhI). Based on the results of the test protocols, a certificate of compliance with the radiation safety criteria was issued.
Table 6.
Changes in people’s specific activity in the gamma spectrum by body parts in case of peroral administration of «Star dust» (SSH&H).
|
No. |
Time |
Head (µSv per hour) |
Chest (µSv per hour) |
Stomach (µSv per hour) |
|
1 |
Control |
0.14 |
0.14 |
0.14 |
|
2 |
1 min 15 sec |
0.21 |
0.19 |
0.18 |
|
3 |
2 min 30 sec |
0.18 |
0.16 |
0.15 |
|
4 |
3 min 30 sec |
0.15 |
0.16 |
0.15 |
|
5 |
5 min 30 sec |
0.12 |
0.13 |
0.14 |
|
6 |
Емах – Еbaseline |
0.07 |
0.05 |
0.04 |
The following dynamics is observed:
Емах – Еbaseline = ∆Е
-
∆Е (head) = 0.07 µSv per hour
-
∆Е (chest) = 0.05 µSv per hour
-
∆Е (stomach) = 0.04 µSv per hour
Conditions of the experiment.
Background in the premises: 0.12 µSv per hour.
Background data for «Star dust» (SSH&H): 0.14 µSv per hour.
Human background level: 0.14 µSv per hour.
The body part where energy undergoes maximum changes is the area where most work is performed. Therefore, the effect on this area is maximal. It is the head in people. The hormesis effect was observed in this experiment. People’s specific activity in the gamma spectrum tends to grow, yet human safe radiation doses were not surpassed in this experiment. “The term ‘hormesis’ was suggested to symbolize the stimulating (favorable) effect of low doses of any toxic substances on the organism” [16] – Anisimov V.N. [17].
- 5 –
There was another experiment related to administering «Star dust» (SSH&H) to people.
Image 1 (Control). Image 2 (Experiment).
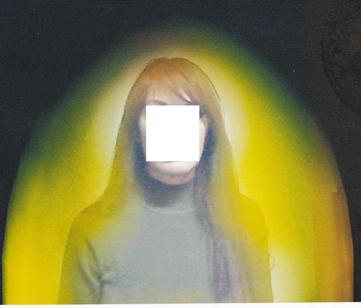
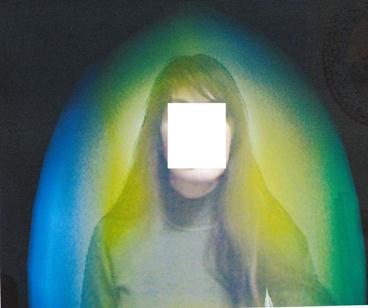
15:50:31 15:56:51
It was a visual experiment. It was based on the Kirlian effect. The experiment is visual but it is far from scientific assessment because the subject was under effect of an induced electrostatic field during the experiment. In the course of the experiment, the subject consumed three food substances: water – 200 ml, sugar – 20 g and «Star dust» (SSH&H). When the subject took water and sugar, the spectrum color remained the same, so we need to describe the administration of the third substance – «Star dust» (SSH&H). Image No. 1 was accepted as the control one. Then the subject received a peroral dose of «Star dust» (SSH&H) in the amount of 0.6 g. Image No. 2 was taken 6 minutes 20 seconds after the substance was taken. The total observation time was 6 minutes 20 seconds.
In this case, we can see a change in the color spectrum. The changes were as follows: the yellow spectrum color becomes green and blue for a short time.
We know from physics that every color is characterized by its individual wavelength.
Table No. 7 [18].
Changes in the range of photon energy depending on the color.
Color Wavelength range, nm
Frequency range, THz
Photon energy range, eV
Violet 380—440
790—680
2.82—3.26
Dark blue 440—485
680—620
2.56—2.82
Light blue 485—500
620—600
2.48—2.56
Green 500—565
600—530
2.19—2.48
Yellow 565—590
530—510
2.10—2.19
Orange 590—625
510—480
1.98—2.10
Red 625—740
480—405
1.68—1.98
There is a wavelength change as the color changes, and the quantum output usually changes at the same time. In this case, the wavelength underwent maximum changes – it was reduced from 590 to 485 nm. The photon energy difference (maximum) was 0.63 eV. The wavelength was reduced as the photon radiation energy increased.
This experiment is an evident demonstration of the fact that when «Star dust» (SSH&H) is administered, it is possible to record an emission of quanta and increase in the photon energy range in people in 6 minutes 20 seconds.
- 6 -
In this work, in the course of a controlled experiment we created conditions to record particles emitted by people. As Mendeleyev D.I. put this, we ‘singled out’ and ‘caught’ this substance. According to the current hypothesis, we can assume that as a result of the experiment we recorded particles with the mass being less than that of electron.
Previously formulated experimental conditions confirm the hypotheses because we can confirm the fact of existence of superlight or vacuum particles:
-
According to Mendeleyev, there is a connection between ether and radioactivity and ‘serious-minded researchers’ can create experimental conditions upon seeing ‘a special ether gas coming out’ of the substance.
Figure 6.
Original work by Mendeleyev D.I., No. 1.
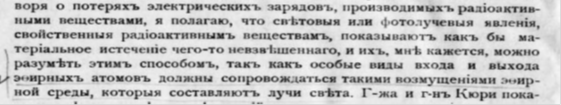
“I assume that the light or photo ray phenomena characteristic of radioactive substances seem to demonstrate the material flow of something unsuspended, and they can be understood by this means because special types of entry and exit of ether atoms must be accompanied by such disturbances of the ether environment, which are ray lights” [19].
Mendeleyev’s D.I. description of an experiment conducted by Mr. and Mrs. Curie.
Figure 7.
Original work by Mendeleyev D.I., No. 2.
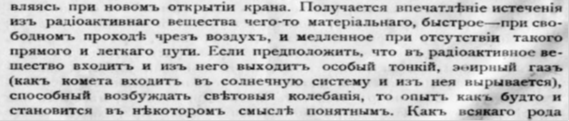
“There is an impression that something material comes out of a radioactive substance – it flows fast in case of free pass through the air, and slowly when there is no direct and easy path. We can assume that a special ether gas enters a radioactive substance and exits it” [20].
-
-
The vacuum physical condition is characterized by low entropy. It is quite possible that we faced superlight particles in the experiment where reduced entropy was observed. “Law of entropy reduction. Klimontovich’s S-theorem” [21].
-
The Dirac equation forecasted the existence of states with negative energy. The relativist connection between energy and pulse in the Dirac theory is in the following form:
E2 = p2c2 + m2c4, which is equivalent to the following ratios:
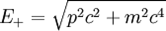 and
and 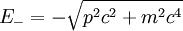
In 1930, Dirac suggested to consider the negative states as an unobserved background fully packed with electrons. Such a background packed with electrons was given the name of ‘Dirac Sea’ or ‘electronic vacuum’.
Both parameters were met in the described experiment: people’s specific activity in the gamma spectrum was increased after peroral administration of «Star dust» (SSH&H), and entropy was reduced, which is confirmed by the reduction in the body temperature [22].
Superlight particles have been discussed since the 19th century. There have been no statistically reliable facts confirming that such particles have ever been recorded.
Mendeleyev D.I. forecasted the existence of vacuum particles, and Kobozev N.I. [23] described them and provided approximate physical and chemical parameters of such particles – he suggested that light particles play an important part in human physiology.
“Among the total entropy in the nature, there is the only entropicless but quite ordered phenomenon, i.e. logical product of our brain and consciousness. This property does not let us consider thinking, which is characteristic of humans only, as a direct product of the biochemical apparatus of the brain only because entropy is inevitably inherent to any biophysical and chemical system. Hence it appears that the brain can think without any entropy only if some ‘negative entropy’ or ‘anti-entropy’ is supplied to the brain” [24].
Thus, being within the limits of the Mendeleyev periodic table, it is impossible to meet the condition required to create low-entropy states of the brain and consciousness under real-time conditions of the brain activities, i.e. under the temperature being a bit higher than the room temperature. The idea that the biochemical matter of the brain comprising heavy and complex molecules with the molecular volumes being millions of times higher than dimensions of geometric phase-space cells can support low-entropy processes is out of question. Therefore, we can assume there are some elementary particles of unknown nature” [25].
“As compared to the atom matter, such particles will seem as areas of nearly absolute ‘material vacuum’ [26].
“Possibility to consider ‘vacuum’ as a necessary component of consciousness and life. Involvement of elementary particles greatly extends the brain functionality. Not only by means of reducing its entropy but also in other substantial respects: elementary particles as a part of relativist quantum mechanics can be transformed into other particles, propagate, ‘disappear’, become the ‘vacuum’ (a state with the minimum energy and zero entropy) and emerge again. All this is unavailable for the atom and molecular matter, which is rigidly bound by the law of mass conservation. The matter is good for building soma only; carriers of mental functions and anti-entropy, which are necessary for life, can be found in the field of elementary particles and fields associated with them” [27].
Mendeleyev D.I. wrote: “But at the present time, when there can be no doubt that the hydrogen group is preceded by the zero group composed of elements of less atomic weights, it seems to me impossible to deny the existence of elements lighter than hydrogen.
The problem of the ether is more or less closely connected with that of gravity, and gains in simplicity when all question of the chemical attraction of the atoms of ether is excluded, and this is accomplished by placing it in the zero group. But if the series of the elements begins with series I containing hydrogen, the zero group has no place for an element lighter than y, like ether. I therefore add a zero series, besides a zero group, to the periodic system, and place the element x in this zero series.
I would like to give it a preliminary name of ‘newtonium’ in honor of immortal Newton.
Neither gravity nor any of the problems of energy can be rightly understood without a real conception of the ether as a universal medium transmitting energy at a distance. Moreover, a real conception of ether cannot be obtained without recognizing its chemical nature as an elementary substance, and in these days no elementary substance is conceivable which is not subject to the periodic law. I will therefore, in conclusion, endeavor to show what consequences should follow from the above conception of the ether, from an experimental or realistic point of view, even should it never be possible to isolate or combine or in any way grasp this substance” [28].
– 7 –
As a part of studies of the effect of «Star dust» (SSH&H) on human physiology, there was a study conducted in the Human Radiation Spectrometry Laboratory, Federal State Institution, A.I. Burnazyan Federal Medical and Biophysical Centre (FGU FMBC) (former State Research Center, Institute of Biophysics).
The goal of the study was as follows: to provide a statistically reliable measurement of the energy of human photon emission as well as theoretic calculation of the mass of emitted particles.
People’s specific activity in the gamma spectrum (using a whole-body counter) was taken as the control data in the chamber (Human Radiation Spectrometry Method), and the measurement time was 600 seconds. As a part of the experiment, people received peroral doses of «Star dust» (SSH&H), and measurements were taken based on changes in the specific activity in the gamma spectrum in the subject being in the chamber (Human Radiation Spectrometry Method); the measurement time was 600 seconds.
Equipment: detectors made by Canberra Industries, Inc (USA), ISO-9001 certified; the Federal Agency for Technical Regulations and Metrology issued certificates for the equipment confirming approval of equipment and verifying the measurement methods. Human Radiation Spectrometry chambers used in the experiment make it possible to obtain a hardware-based spectrum of human emission minus the background radiation level.
There were three models: volunteers including a man with the body mass of 70 kg, and two women with the body mass of 58 and 52 kg.
Table 8.
Results regarding changes in the human specific activity in the gamma spectrum.
No. nuclide
reliability
activity
subject
dynamics
∆
1 134 Cz (Bq)
9.9
M, 70 kg
increased activity
19.9 (Bq)
29.8
2 137 Cz (Bq)
89.6
M, 70 kg
reduced activity
- 16.2 (Bq)
73.4
3 40 К (Bq)
3,001
M, 70 kg
increase
473 (Bq)
3,474
4 40 К (Bq)
0.95
2,168
M, 70 kg
increase
775 (Bq)
0.89
2,943
5 Ra (Bq)
1.00
157.2
M, 70 kg
reduction
- 157.2 (Bq)
0
6 40 К (Bq)
0.92
1,727
F, 58 kg increase
4,304 (Bq)
0.92
6,031
7 Not identified
(keV)
0
M, 70 kg increase
157.49 (keV)
157.49
8′ Not identified
(keV)
0
F, 58 kg
increase
157.49 (keV)
157.49
9 40 К (Bq)
1.00
1,630
F, 52 kg
increase
1,072 (Bq)
2,702
10 Not identified
(keV)
0
F, 52 kg
increase
114.38 (keV)
114.38
11 40 К (Bq)
1.00
1,840
F, 58 kg
increase
3,227 (Bq)
5,067
12′ Not identified
(keV)
0
F, 58 kg
increase
157.49 (keV)
157.49
(8′, 12′ – there is a reliable peak on the spectrogram but it is not shown in the report).
Hardware-based spectrum of human emission minus the background radiation level.
Taking into consideration that a reliable undefined peak of gamma quanta with the energy of 157.49 keV was obtained, the error is ± 45.78, the errors are 1.000 rms deviation (root mean square deviation), which was measured by using certified equipment in keV, a decision was taken to consider the energy change as the baseline level for the purposes of theoretical calculation of the mass of particles emitted by people under certain conditions. Data about an increase in the net area of the peak are a supplementary condition confirming the fact of people’s emission:
Table 9.
Changes in the net area of the peak.
Prior
After
Error
31
51.3
± 6.91
0
10
± 6.09
35
96.3
± 6.97
The mathematic calculation was carried out according to the Special Relativity Theory establishing a connection between mass and energy in the form of the Einstein formula E = mc2.
-
Wavelength.
 , where
h is the Planck constant 4.135667 × 10⁻¹⁵ eVs
с is the speed of light 2.997 × 10⁸ m/s
 = m
= m
λ =
 ×2,997×108 =
  ×10-10 = 0.0787008 ×10-10 =7.87008×10⁻¹² (m) = 7.87008 × 10⁻³ (nm)
Based on the obtained value, we can conclude that the wavelength emitted by people lies in the spectrum of gamma radiation. A table for reconciliation is given below.
Table 10.
 Characteristics of the electromagnetic wave.
-
Frequency.
 , where c is the speed of light and λ is the wavelength.

 = 0.3808093×1020 = 3.808×10¹⁹ (1/s) = 3.808×10¹⁹ (Hz)
The obtained results regarding the wavelength emitted by people lie in the gamma spectrum.
-
Verification.
According to the spectrometry data, Е1 = 0 keV, Е2 = 157.49 × 10³ eV
∆Е = Е2 -
Е1 = 157.49 × 10³ eV
On the other hand, ∆Е = Е2 -
Е1 = Ѱ × h,
Therefore, 157.49 × 103 = 3.808 × 1019 × 4.135667 × 10-15
Dimension: eV = eV × s ×
 , so eV = eV
157.49 × 103 = 4.135667×10-15 × 3.808 × 1019
157.49 × 103 = 15.7486 × 10⁴
157.49 × 103 = 157.486 × 10³
157.49 × 103 = 157.49 × 10³
-
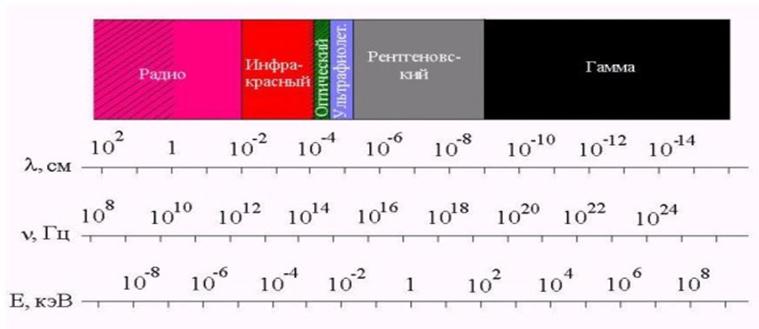
Mass.
Е = mc2
m = E/c2
∆Е = ψ×h, therefore m =
 Therefore,
m =

In this case, the Planck constant h is equal to 6.626068 × 10⁻³⁴ J×c
Dimension
m =
m =
 = 0.2809247 × 10-30 = 2.809247 × 10⁻³¹ (kg)
In all,
As a result of observations under controllable experimental conditions, particles characterizing the fact of people’s photon emission were detected.
The wavelength of the particles is 7.87008 × 10⁻³ (nm);
Frequency is 3.808×10¹⁹ (Hz);
Particle mass is 2.809247 × 10⁻³¹ (kg)
The mass of the particles is less than that of the electron by 3.25 times. Even taking into consideration the error of the measurement method (± 45.78), the mass of recorded particles is mpart ≤ me.
Table for comparison.
Table 11.
Characteristics of elementary particles.
Characteristics of elementary particles
Description
Symbol
Charge
Mass
C
e
kg
u
Proton
11Р
1.6×10⁻¹⁹
+ 1
1.7×10⁻²⁷
1
Neutron
10n
0
0
1.7×10⁻²⁷
1
Electron
ē
-1.6×10⁻¹⁹
- 1
9.11×10⁻³¹
0.0005486
- 8 -
Electric and magnetic fields do not deflect gamma radiation, which has a weak ionizing power and very high permeability. Gamma radiation is short-wave electromagnetic emission with a short wavelength and, as a result of this, evident corpuscular properties, i.e. it is a flow of particles – gamma quanta (photons).
Gamma radiation is a hard electromagnetic radiation, and it lets out energy during the transition of nuclei from an excited state to the regular one or less excited state as well as in the course of nuclear reactions.
Gamma radiation does not entail any changes in the nuclei charge and mass number. Gamma radiation is not an independent radioactivity type. A daughter (not mother) nucleus emits a gamma quantum, which is in an excited state when generated.
Gamma quanta have a zero rest mass and cannot slow down in a medium.
There are several processes involving interaction between gamma radiation and substance.
1. Photoelectric effect – the mechanism of gamma quanta absorption prevails at the energy of Еγ ≤ 100 keV.
2. Compton scattering at the energy of gamma quanta of 500 keV < Еγ < 1.02 MeV.
3. Generation of electron-positron pairs at the energy of Еγ >1.02 MeV becomes the main process of interaction between gamma quanta and substance at Еγ > 10 MeV.
4. If the energy of gamma quanta exceeds the nucleon binding energy in the nucleus (7-8 MeV), nuclear photoeffect can be observed.
Figure 8.
Energy of interaction between gamma quanta and substance.

As a part of the studies, the human emission energy of 157 keV was recorded. There is no data concerning the interaction between gamma quanta and substance.
On the other hand, astrophysics studies the Universe based on the diffused gamma background. Gamma quanta contain an important information about the nature and evolution of the intergalactic environment as well as structure and evolution of the Universe. Gamma quanta have high permeability and contain information about very remote parts of the Universe. Analysis of the diffused gamma background in astrophysics makes it possible to obtain information about the nature of remote astronomic objects located at a considerable distance from us and helps understand physical processes taking place in the astronomic objects.
As a result, three components are reliable:
-
People generate electromagnetic waves in the form of gamma radiation at the range of 157 keV.
-
There are no data on interaction between gamma quanta having the indicated power and matter.
-
At the same time, the flow of gamma quanta the man emits contains a huge volume of information about the man.
What is the evolutional intention of the Universe? Why do people transmit information about them going to the Universe at the speed of light?
- 9 –
In the course of our studies, the following results were obtained under controllable conditions.
A supraphysiological mechanism of human ageing instead of the physiology-based one was postulated. This means that it launches the mechanism of physiological ageing.
In the course of observations and studies, particles emitted by people under certain conditions were detected. The wavelength of the particles is 7.87008 × 10⁻³ (nm); the frequency is 3.808 × 10¹⁹ (Hz); the mass of the particle is 2.809247 × 10⁻³¹ (kg).
The fact that people emit such particles is closely related to the state of people’s health and their lifetime.
The man is an open quantum and a biological system being in continuous interaction with the environment.
The man emits an electromagnetic wave in the range of gamma quanta four times a day.
Mineral substances deposited in the bone mass enable people to generate the electromagnetic wave.
These studies were conducted to explain the mechanism of action of «Star dust» (SSH&H) substance of the first generation.
Literature sources cited in this work:
-
Leenson I.A. 2009. Radioactivity inside us, Khimiya i Zhizn, No. 7, page 36-38.
-
Kaplan A.V. 1984. Age-related changes in the bones. Zdoroviye (84/12), page 12.
-
Putlyaev V.I. 2004. Modern bioceramic materials. M.V. Lomonosov Moscow State University. Soros Education Journal, Vol. 8, No. 1, page 45.
-
W.Chairman Sryder 1975. A Conventional Man.
-
Harry K. Genant. 1999. Recommendations of the World Health Organization Task-Force for Osteoporosis. Osteoporosis i Osteopatii, medical research and practical journal, No. 4, pp. 2-6.
-
Krymova T.G., Kolkutin V.V., Samarin A.I. 2008. Determining the human age based on the analysis of the element composition in the bone tissue. Voenno-Meditsinskiy Zhurnal, Vol. 329, No. 2, pp. 20-27.
-
Krymova T.G., Kolkutin V.V., Benyaev N.E. 2007. A study of the element composition of the bone tissue by the laser mass spectrometry method for the purposes of diagnosing medical and biological signs of people. Sudebno-Meditsinskaya Ekspertiza, Vol. 50, No. 6, pp. 19-24.
-
Sveshnikov K.A., Ruseikin N.S. 2007. Mineral density of bones in large body segments from the age-related point of view. Sovremennye Problemy Nauki i Obrazovaniya. No. 6, pp. 38-43.
-
Shostak N.A., 2011. Osteoporosis: modern diagnostics and treatment aspects. Lechashiy Vrach. 07/04, http://www.lvrach.ru/2004/07/4531513/
-
Tyrtova D.A., Erman M.V., Tyrtova L.V., Ivashikina T.M. 2009. Osteoporosis in children and teenagers. Bulletin of the St. Petersburg University. Medical Department, Series 11. Issue 2, pp. 168-172.
-
Krichkov A., Shnaybel O. 2011. Practical confirmation of the possibility to implement a crystal mineral matrix in the human organic matrix. Moscow, Sputnik, pp. 38-39.
-
Vikkulova A.T., Ishmuratova G.M. 1999. Bioelementology of s-, p- and d-elements. St. Petersburg. Nauka, pp. 182, 186-188, 192, 206, 210, 220, 240, 249.
-
Ignatova T.N. 2010. Regional biochemical features of accumulation of chemical elements in the ash residue of a human body. Proceedings of the Tomsk Polytechnic University, Vol. 317, No. 1, pp. 178-183.
-
Frolkis V.V. (1924-1999) – professor, physiologist and gerontologist, Vice-President of the Ukrainian Academy of Medical Sciences, Chief of the Ageing Biology Department, and Head of the Physiology Laboratory, Gerontology Institute, Ukrainian Academy of Medical Sciences, who came out with the adaptation and regulatory theory of age-related development (from the gene and regulatory hypothesis of ageing).
-
Frolkis V.V. 1988. Ageing and Increasing the Lifetime. Academy of Sciences, USSR. Leningrad, Nauka, pp. 87-88.
-
Anisimov V.N. 2008. Molecular and physiological mechanisms of ageing, Vol. 1. St. Petersburg. Nauka, page 292.
-
Anisimov V.N., Doctor of Medical Sciences, Head of the Carcinogenesis and Oncogerontology Department, N.N. Petrov Research Institute of Oncology, President of the Gerontology Society, Russian Academy of Sciences.
-
Wikipedia, http://ru.wikipedia.org/wiki
-
Mendeleyev D.I. 1905. An Attempt Towards a Chemical Conception of the Ether. Saint-Petersburg, typolithography by M.P. Frolova, page 38.
-
Ibid, page 38.
-
Klimontovich Yu.L. 1983. Entropy reduction in the course of self-organization. S Theorem. Letters to Zhurnal Tekhnicheskoi Fiziki, Vol. 8, pp. 1412-1416.
-
Krichkov A., Shnaybel O. 2011. Practical confirmation of the possibility to implement a crystal mineral matrix in the human organic matrix. Moscow, Sputnik, pp. 32-34.
-
Kobozev N.I. (1903-1974), physicist and chemist, Prof., M.V. Lomonosov Moscow State University, Head of the Catalysis and Gas Electrochemistry Laboratory (1947-1974), Chemistry Department, Moscow State University.
-
Kobozev N.I. 1971. A thermodynamic study of information and thinking processes. Moscow, Moscow State University Publishers, page 173.
-
Ibid, page 177.
-
Ibid, page 181.
-
Ibid, page 182.
-
Mendeleyev D.I. 1905. An attempt towards a chemical conception of the ether. Saint-Petersburg, typolithography by Frolova M.P., pp. 26-27.