АППРОКСИМАЦИЯ НЕЛИНЕЙНЫХ ЗАВИСИМОСТЕЙ В ЭЛЕКТРОННЫХ ТАБЛИЦАХ
Киевский политехнический институт им. Игоря Сикорского
кафедра технологии неорганических веществ и общей химической технологии
Аннотация
Представлен способ получения нелинейных зависимостей любого типа на основе использования функции линеаризации числовых зависимостей программы Excel. Данная функция аппроксимации основана на методе наименьших квадратов и поэтому доступна и в LibreOffice и в других системах программирования. Данный подход проиллюстрирован на примере аппроксимации степени превращения химической реакции в зависимости от двух и трёх параметров.
AN APPROXIMATION FOR NON-LINEAR DEPENDENCIES IN SPREADSHEETS
Igor Sikorsky Kyiv Polytechnic Institute
Faculty of Chemical Technology, Associate Professor
Abstract
A method for obtaining nonlinear dependencies of any type is presented based on the use of the function of linearizing the numerical dependencies of any spreadsheets. This approximation function is based on the least squares method and is available in Microsoft Excel, Libre Office, and other programming systems. The basis of the proposed approach is the deception of the LINEST function, in which a non-linear dependency is formatted for use with a function that processes linear dependencies. This approach is illustrated by an example of the approximation for the conversion degree of a chemical reaction as a function of 2 or 3 parameters.
Keywords: "Cheating" the function, approximation function, data processing, Libre Office, LINEST, nonlinear dependencies
Рубрика: 05.00.00 ТЕХНИЧЕСКИЕ НАУКИ
Библиографическая ссылка на статью:
Концевой А.Л. Аппроксимация нелинейных зависимостей в электронных таблицах // Современные научные исследования и инновации. 2018. № 6 [Электронный ресурс]. URL: https://web.snauka.ru/issues/2018/06/87030 (дата обращения: 30.07.2026).
In various scientific studies, there are typical components that are characteristic for different stages. At the stage of processing the experimental data, such steps are the approximation of the experimental data obtained, an assessment of the adequacy of the model obtained and its use to determine the optimal or rational parameters of the process under study. In this article, the first stage is considered and a way of using the linearization function to obtain any nonlinear dependencies is described.
A common use of the LINEST function
To solve this problem, the built-in function “ЛИНЕЙН” (LINEST) is used, the possibilities of which are given in Excel’s help or in books [1]. Usually, this function is used to obtain linear dependencies from one or more parameters. To use it for nonlinear dependencies, such initial data are preliminarily linearized by logarithm. An example in chemistry is the processing of kinetic data to obtain values of the order of reaction, rate constants, and activation energy.
However, not always linearization using logarithm leads to the desired result and therefore the standard use of the LINEST function is not applicable. The solution is the “deception” of this function, in which a non-linear relationship is organized on a sheet of the spreadsheet in the required format. It should be noted that the choice of the initial non-linear dependence (power series, exponential or any other) is made by the user. That is, the accuracy of the obtained approximation will depend not on the LINEST function, but on the chosen nonlinear dependence format.
Let’s consider the given approach on a concrete example of approximation of dependence of function on two and three parameters: degree of oxidation in a chemical reaction from the concentration of a reagent and time of contact. We first estimate the accuracy of a simple linear approximation for these data (fig. 1).
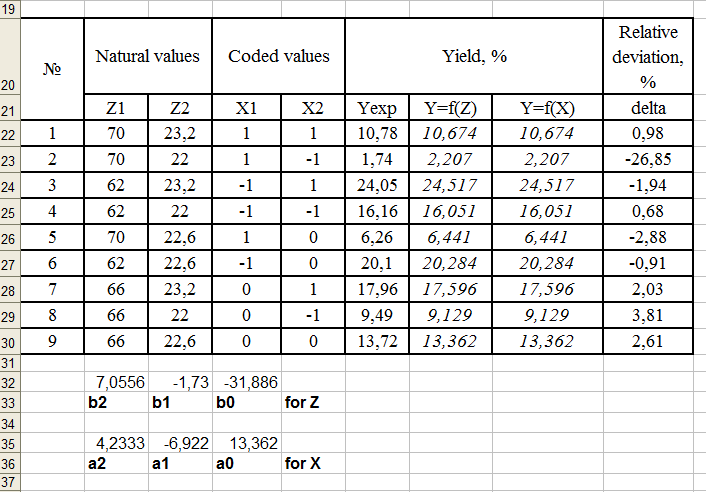
Figure 1. Data processing with LINEST function
The results of the study were obtained on the basis of a previously designed experiment [2] on the effect of temperature and concentration on the degree of conversion. Naturally, any set of data can be approximated provided that such data is sufficient to determine the unknown regression coefficients.
The results of a simple linear approximation (fig. 1) indicate a complete coincidence of calculations based on natural (regression coefficients bi) and coded (regression coefficients ai) parameters. Relative deviations are up to 3 percent in the main. However, the 2nd point with a slight absolute deviation gives 27% of the relative deviation.
“Cheating” the Function
The basis of the proposed approach is the deception of the LINEST function, in which a non-linear dependency is formatted for use with a function that processes linear dependencies. Figure 2 shows the results of calculations for a nonlinear second-order model with natural parameters. The level of relative error is 0.01-0.04%.
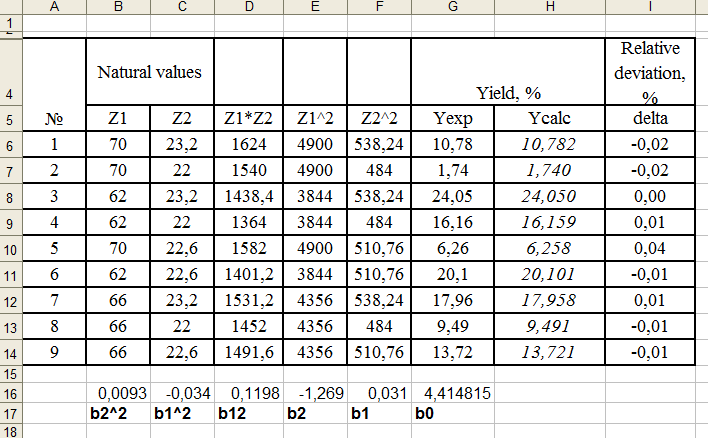
Figure 2. “Cheating” the LINEST function
It should be noted that the LINEST function returns the regression coefficients in the reverse order. To obtain these coefficients, one need to use the procedure “select, F2, Ctrl-Shift-Enter” [3]. Interestingly, the Calc program in LibreOffice displays the results of the function with several results without additional user actions (fig. 3)
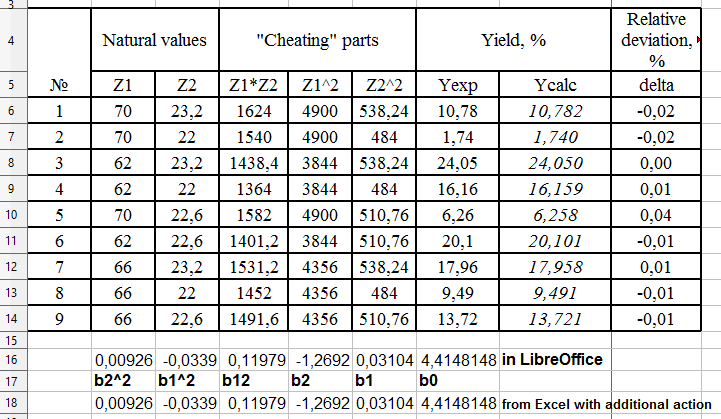
Figure 3. “Cheating” the LINEST function in Libre Office without ”select, F2, Ctrl-Shift-Enter” action
Application to a function of three variables
Let us consider the results of approximation for a variant with three parameters. The same trend with respect to the accuracy of simple linear (fig. 4) and non-linear approximations (fig. 5) is retained for this variant.
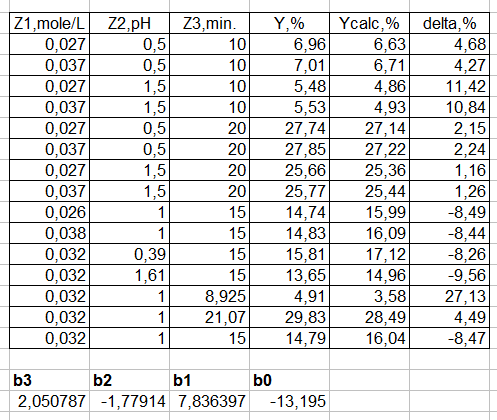 Figure 4 - The usual application of the function
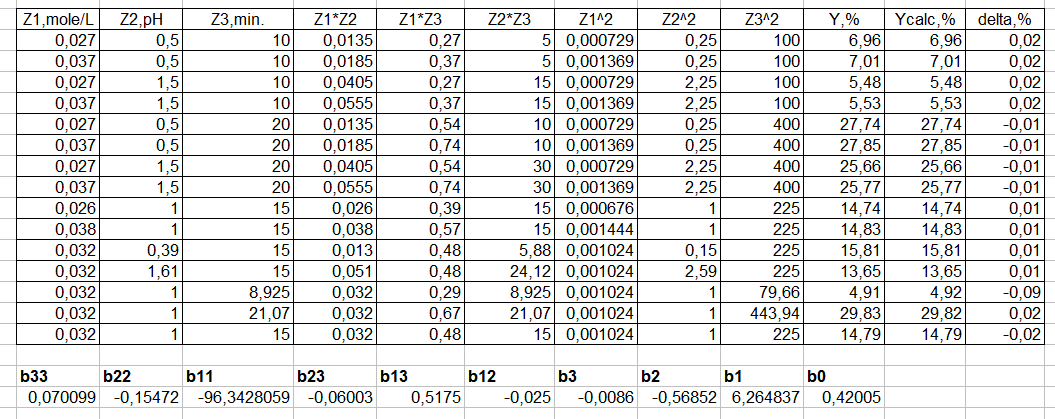 Figure 5. The unusual application of the function
It’s obvious that the inaccuracy of simple approximation increases and the accuracy of nonlinear approximation remains at a very good level.
Conclusions
The presented approach to the treatment of experimental data has been used for many years at the Authors’ Department in KPI. In addition to solving actual problems in the processing of experimental data, this approach is of pedagogical interest as an example of a non-standard solution based on the well-known. It should be noted that neither the Excel Help nor the excellent book by John Walkenbach considers such application of the LINEST function for data processing.
References
- John Walkenbach. Excel 2003 Bible. Wiley, 2003. ISBN 9780764539671
- DOE. URL: https://en.wikipedia.org/wiki/Design_of_experiments
- Kontsevoy S., Kontsevoy A. Functional calculation of process flows' parameters in spreadsheets // Modern scientific researches and innovations. 2018. № 5 [Electronic journal]. URL: http://web.snauka.ru/en/issues/2018/05/86532
Все статьи автора «Концевой Сергей Андреевич»
© Если вы обнаружили нарушение авторских или смежных прав, пожалуйста, незамедлительно сообщите нам об этом по электронной почте.