According to the opinion of the author of this paper, financial analysis of business systems today may not be sufficient without market research. A firm may have a perfect even an ideal competitive financial performance (for a time of calm before the ‘storm”), an ideal innovative technology, staff, clientele, PR, …., But, while at the same time be bankrupt … … or almost bankrupt … .. or go to the huge multi-million or even billions of dollars in damages … ..
The modern world is littered with such examples. Polaroid had a unique advanced technology, perfect financial performance, many orders, excellent staff, and the image of the world-known-brand…. quickly, in just an half a year, it came away from the market. Mercedes is perfectly competitive company, including the time, when it was close to be bankrupt. Toyota finished 2009 with a multimillion-dollar losses (we do not take the real-time situation, when these losses are primary caused by the recent earthquakes, that got started from March 2011 and are not yet ended by the end of 2011), although it was and it is an ideal company in terms of financial analysis (a year before 2009 and 2011 the financial analysis wouldn’t reveal clearly the trends of 2009 and 2011). Stern Holdings, the world advanced construction mega-corporations from the past with the state estimated in billions of dollars at more than an half a year before its financial bankruptcy, had an ideal financial performance: a phenomenal growth. Such examples in the modern world can be found among a large number of business-subjects among practically all the economic sectors: agriculture, petroleum, metals, automotive, construction, textiles, wholesale and retail trade, socio-cultural service (hospitality) and tourism and so on ….
And so it was not only in the 20th and 21st century, and even much earlier. And then the bankrupt companies could be found virtually in all the industries. For example, there were no bad trends vivid evidences even two weeks prior to the John Layter’s financial corporation’s bankruptcy; the corporation which was led by John Layter in the late 19th century in the United States, and it was a corporation which had tens of millions of dollars of liquid assets (at that time it was a tremendous amount) and a lot of expensive goods for resale …. and, just in two weeks, the situation has changed so that the company went bankrupt in no time …! It cannot be so easy in a modern economy just to take a company and to conduct its financial analysis in isolation from the marketing segmentation.
In Russia, it is important to know such a feature – that the segmentation should be exactly of Russian actual market! That is why the market analysis should be a kind of ‘safety cushion” of the overall financial analysis. It is the analysis that should timely identify prospects for certain industry, for certain market and for certain company in their existence and to dete RMI ne the prospects for a firm within a particular market segment. Let’s examine the domestic market during the period from 2000 to 2010. If we consider the main sectors of the economy as a whole, we can draw the following conclusions regarding the main trends of development. Peak Development came in the 2000 – 2008 years for virtually all sectors of the economy, while the largest economy growth was from July 2003 to August 2008.
The growth was so rapid that it was almost the time when there were very few non-profitable sectors. Even traditionally crisis agriculture industry and the textile industry (which “fights” for decades now with China for a market share) were aligned to bring stable income. Of course, the forefront of the economy now and then, incidentally, was the fuel-energy complex in the sections of fossil-fuel-flowing (FEC-1) and processing of fossil fuels (FEC-2 ). The main sectors in the domestic economy are agriculture (A/C ); fuel and energy sector / part of: fossil-fuel-flowing / (FEC-1); fuel and energy sector / part of: processing (refining) of fossil fuels / (FEC-2 ); resources mining industry / part: with the exception of fossil fuels (FEC-1) / ( RMI ); food, tobacco and alcohol processing, products (FTAP ); textiles (TEX); woodworking and wood processing industry (WWP ); pulp and paper production, publishing and printing (PPPPP); metallurgical complex with all the ancillary industries (MET); automobile industry (Auto); construction (CON); wholesale trade except for wholesale trade of motor vehicles (WST ); retail trade except for retail trade of motor vehicles (RetT); socio-cultural-service-and-tourism /Russian for: hotel industry, restaurants and other food industry establishments, entertainment and hospitality, tourism, entertainment and organization of such activities / (HOSP); real estate / real estate transactions, leasing and other services related to Real Estate / (RE); education industry / kindergartens, schools, technical schools and colleges, institutes, academies, universities, research institutes and similar organizations / (EDU); service industries, including utilities and except for financial services (SER).
It is clear from the above mentioned material that the domestic economy is very diverse in areas of activity. For ease of reading, the author will use the abbreviations listed in parentheses for each sector of the economy to avoid a repetition, sometimes, of quite lengthy descriptions and definitions, you, dear reader, in turn, should realize that the definition and interpretation of the general concepts are presented earlier. Let us return now to the marketing segmentation. How you do, dear reader, remember that the domestic economy grew until August 2008. If we take and analyze the data of tax accounting of all these industries, we shall be able to identify the relative weight of each industry over the past nearly 10 years in terms of the total tax base. As you, dear reader, remember, the tax is levied on the so-called taxable income, adjusted in accordance with the tax accounting (not all costs can be attributed to the lowering of the tax base, as you, dear reader, remember). The average industries” efficiency has the following manner, according to tax returns for the period, grouped to the structure of industries:
Scheme: Average structure of the total value of the tax base by sector from 2000 to 2010
![Scheme: Average structure of the total value of the tax base by sector from 2000 to 2010 [Alexander Shemetev]](http://content.snauka.ru/web/6009_files/s1.jpg)
The above graph shows that the country’s tax base are Fuel-Energy-Complex (FEC) and metals, which together account for 47%, and if we add to them 4% of DPI, we find that these areas of the economy worth 51% of taxable income over the last decade. Along with them, the growth in property prices over the last decade led to the level of advanced yet another industry – real estate, which developed in Russia in a specific way even during the crisis times: the prices for property in Russia decreased little during the crisis beginning, and, after it, began to rise again.
Rent, maintenance transactions and transactions in the secondary housing market has become so profitable that it can compete even with the domestic steel industry in terms of taxable income. The industry that should be estimated apart – is the wholesale trade industry, which covers up to 25 times the volume of retail trade at the specified index. The wholesale trade industry as a whole can compete with oil. The recent crisis in the construction business, along with an increase in yield of major agricultural corporations, virtually leveled the two sectors forward in terms of profitability, which take a pride place number 8 and 9 in terms of taxable income.
Moreover, agriculture – this is only a part of the agro-industrial-complex (AIC), which expands its influence in the sector of food production, which puts agriculture at one level to the sectors of mining, construction and other industries, surpassing the volume of retail sales at times. In fact, agriculture ranks 6th on the amount of the tax base in the country, which, considering that the first three places are occupied by oil and metallurgical complex, is an excellent indicator for the “former industry-in-crisis”, which had lost much in the 1990s, and today has become a powerful basis for the whole economy, because some agricultural companies received strong shocks to development.
However, as it may seem paradoxical, there is no fully rational reason for the domestic market segmentation based upon objective indicators of the tax base of companies. There are some practices that are widely applied in Russia like financial statements” optimization transformations in order to minimize the tax base itself in various ways that in itself distorts the above concept. Second, there are a number of factors that argue in favor the concept of the idea to apply some additional indicators in the overall analysis of the market. In particular, let us work together with you, dear reader, and look at the following schedule: Graph: Histogram of the structural changes of industries in terms of a structural shift of the tax base on data from 2003 and 2010
![Graph: Histogram of the structural changes of industries in terms of a structural shift of the tax base on data from 2003 and 2010 [Alexander Shemetev]](http://content.snauka.ru/web/6009_files/s2.jpg)
That Histogram shows that the oil sector confidently pulls the structure of the economy in its favor, roughly, just over 2.6% annually. Among non-oil sectors of advanced triple, which gradually “pulls a structural blanket” of the economy on itself, the attention should be allocated in a wholesale trade, A/C and retail trade. These three sectors of the economy pull structural “a structural blanket” with trends substantially lower than oil – about 0.75% per year in total. The mentioned above trend pulling is connected with the fall of the structural weight of the metallurgical complex at 1.75% per annum, and with the fall of automotive, real estate, PPPPP industries. Investments that are in these sectors – they are gradually going to fund more successful in economic terms sectors. Other industries are also losing structural weight, together with this, this process is very slow.
Before we, together with you, my dear reader, shall consider the segmentation of the modern Russian market, we should make a slight digression, for how market segmentation was carried out earlier…. in the past…. Conventionally, in the history of the domestic market segmentation, there can be divided two phases: the Soviet market period and a new market stage. In the Soviet Union they conducted market segmentation by means of specialized institutions of the economy (the so-called NIIs - National-scientific Investigation Institutes), which led the development of production plans (the most kinds of plans were the so called 5-year plans (the term came to the then science from the Russian then slang: “Pyatiletka”)). Then there was only one model of market segmentation: with a focus on opportunity cost (more precisely, an imputed opportunity cost). Then the NIIs analyzed the isolated multiple-components-cost-structure, which was based on planning.
The basis of the cost was the cost of the so-called production cost at department, which consisted of material costs, which were subtracted from the return waste (raw materials, which should then be proceeded by the re-processing procedures, such as sawdust in the wood industry). Next, they added the value of labor costs of production workers, depreciation and maintenance of fixed assets (in accordance with regulations) and other costs. If we detailed the cost structure, we would receive the following costs: raw materials, purchased components, intermediate products, services, recurrent wastes (subtracted), fuel and energy for the technical and technological goals, the basic wage of production workers with additional charges and social contributions, the cost of training for production and development of production, costs of maintenance and operation of equipment and other expenses. The result of this sum is the full so called in-department cost of production, which then was added to overhead expenses and loss of spoilage, as well as certain other expenses.
The result of this extra-adding would be the production cost, which then was adjusted to the amount of so-called non-productive costs to get the full cost. Then this cost was divided by the estimated output; the resulting figure was the total unit cost. Now the process of cost calculation is similar inside many of the nowadays Russian enterprises. The difference between the old and new methods to calculate unit cost is in the fact, that earlier, in the USSR, they estimated total imputed cost of a kind, that is, the standard unit cost for companies within the industry. Sale price was also normalized. The New Market was opened after the transition to a market economy; the segmentation of this New Market was a term nobody thought about. Instead of this, companies, usually, used a simple calculation model: cost + standard of profitability, which can be expressed in the following formula (1):
![]()
There was also a scientific and a rarely used in practice model to dete RMI ne the optimal price of the goods. It was associated with so-called variable costs. In summary it can be expressed as follows (2):
![]()
Where: Price - is the final unit price; Cost full at production item unit - is the full cost per unit of output, it is the full amount of the unit cost of production; PROFITABILITY RATE cost full at item unit - this is desirable or estimated value of the profitability of the unit cost of production; Cost variable at production item unit - is the sum of variable costs calculated per unit of output; PROFITABILITY RATE cost variable at item unit - this is desirable or estimated value of the profitability of the unit’s variable costs of production
That is how the price was dictated then. Segmentation was not a thing to be performed, because everything then was literally swept away from the shop and market shelves, and that is why there was no necessity to take competitors into an account. With the advent of market economy, the market began to saturate gradually. Then, gradually became more popular following type of calculation of the total price of the product (3):
![With the advent of market economy, the market began to saturate gradually. Then, gradually became more popular following type of calculation of the total price of the product (3) [Alexander Shemetev]](http://content.snauka.ru/web/6009_files/f3.jpg)
Where: COST FULL - is the full unit cost. Thus the total cost of production was calculated then. In the same manner it was calculated the amount of income that the entrepreneur would like to earn over a certain period (eg one year). In corresponding to this the sales volume and price were calculated at the volume enough to receive a specified rate of income.
While, many companies didn’t think then about the pricing policy, and they worked in the “old fashioned way”. Gradually, the market economy had increasingly been becoming to dictate its strict conditions. Competition tightened. Many companies began to leave market en masse because of their lack of market efficiency. Much has changed since those years. Unfortunately, however, the internal policies of many local companies aren’t still built on the definition of market segmentation, market share, its sales volume, issues of the market adequacy of its activities, and dete RMI nation of the optimal price for a commodity. Most of these companies are gradually leaving the market, donating their position to more successful in the marketing and financial management spheres competitors.
Optimal commodity price for a company, unfortunately, is not the same as the company’s position in the market segment; of course, if it wasn’t be so, it would easier much the life of analysts around the world! Position in the market – is synonymous with the market segmentation. These terms relate between each other as follows. To dete RMI ne the position at the market, companies need to divide it into segments. The largest segments are the supra-national economies, such as Eurasian economic system that is different, say, from North American. Then there come the country segments, multiregional, regional, and so on. Along with this, there are many other market segments. For example, manufacturing, wholesale trade, education, agriculture and so on, each of which has its specific features. Segmentation of the market can go up to infinitesimal micro-segments….
Moreover, successful companies, usually, often developed themselves in the neglected segments. Thus, segments of cars for everyone; computers for each person; TVs for everyone,…. – All of these segments for a certain time were ignored by everyone, however, until the first successful companies pioneered in them …. Therefore, the cluster analysis is used mostly in the west for the qualitative dete RMI nation of the structure of segments, which, at the same time, is one of the most expensive types and market analysis. The author of this paper has developed for you, dear reader, the analogy of the cluster model analysis in order to apply it to everything and everyone, in this case, the calculations and comparisons conducted by individually you, dear reader, would be not so expensive with the minimum discrepancies from the information that could be obtained by using a much more expensive cluster analysis.
The author of this paper provides a convenient model to estimate and dete RMI ne the position and the company’s market share at the market segment, that will slightly open knowledge of how successful a particular company is in a given market segment. Now, when we get a glimpse into the domestic economy and the problem of segmenting the market, let’s move on to the actual segmentation of the domestic market. The author of this paper (this is me) has developed his own model to comprehensively and successfully segment the domestic market for companies. The technique can be schematically represented as follows:
Scheme: the Alexander Shemetev’s method: company’s segmentation at market
![Scheme: the Alexander Shemetev’s method: company’s segmentation at market [Alexander Shemetev]](http://content.snauka.ru/web/6009_files/s3.jpg)
This scheme is necessary to be commented. Alas, all companies in the market can be divided into two major categories: solvent and insolvent. It is clear that the segmentation of the market in a state of crisis is very different from the normal segmentation of a successful business system. According to the concept of the founder of the social and ethical marketing, Ph. Kotler (Ph. Kotler, 2008), the company positioning at the market can be reduced to three core strategies, following which a company can succeed, and, on the other hand, if the company will adhere to more than one strategy at once – it is highly likely the company to leave the market. These strategies are: cost leadership (calculated at minimum cost, price and simultaneously selling the maximum volume possible), the leadership in positioning (positioning of the goods – it’s positioning by fashion, quality, design, geographical location, additional services, packaging and so on / sometimes this strategy is called as differentiation/), leadership at a narrow segment (for example, the production of sponges for industrial climbers, skateboards, scuba diving equipment, software for weather stations and so on). In the case of leadership at a very narrow segment a company can combine both cost leadership strategy and leadership on positioning strategy.
Thus, there are four types of market positions for each company at the market: three for successful companies and one for the unsuccessful. Each type of business system has its own unique set of models. Let’s start with the introduction of stable and successful companies, and with the strategy of cost leadership. The strategy of cost leadership involves ensuring minimum cost product for maximum sales. This strategy is particularly important specified for the Russian economy, because the companies which are concentrated at this strategy provide much of the revenue to the country’s treasury. This strategy is pursued by the majority of fuel and energy complex FEC-1 and FEC-2 companies, a significant portion of steel companies, as like as mining, and agriculture companies.
The total volume of these companies in the mass of the taxable profit estimated on its average value, during the period from 2000 to 2010, is more than 51.5%, which is extremely important to the economy. In this strategy, there is a certain standard of finished product for mass production (steel products, gasoline AI-92, crude oil grade Urals, the grain of the highest category and so on) to which these companies must continually reduce costs in all possible forces to remain competitive.
Because of this these companies are suitable for the two models which are developed by me for the segmentation of the market: mono-parametrical and segmentary model, which should be used in tandem, which means: together. Let’s look at them closely. Alexander Shemetev’s model: the mono-parametrical segmentation model of the Russian company at the market For companies which follow this strategy the two mono-parametrical models should be calculated: cost-oriented and focused on the variations in quality indicators. We should distinguish between themselves both the model to assess the feasibility of introducing a new product to the company and the model of proper segmentation at the market. The price of a new product introduction for such companies is:
![]() (4)
(4)
Where: P(NP) - is the total price of a new product; P(UP) - is the total price of the underlying product; I(NP) - is a measure of the increment of the main technical parameters, which are significant for the product, and which should be expressed in a multiplicative terms. Multiplicative expression of common percentage (MEC) is estimated by a simple formula:
![]() (5)
(5)
Where: P (%) - is the percentage of increased, in comparison with the base product, new product main parameter for evaluating the feasibility of its implementation. For example, if the introduction of a new product increases the key parameter of the underlying product to grow by 25%, the value of the MEC is 1.25 (125%).
However, this does not mean that all products should be introduced, whose P(NP) will be maximum, as well as the set I(NP) parameter. It should be remembered that the basis for the development strategy of this type for companies should be:
![]() (6)
(6)
That is, the minimization of costs in all possible ways. If a new product is, in prospect, as much as a product for mass production at minimum cost (eg, fuel ethanol); – then these companies should make sense to consider the effectiveness of its implementation. This simple model allows to describe the pattern of companies of this type. Now, let’s go straight to market segmentation. The author of this paper developed a model for the segmentation of the market for this type of business systems for the major sectors of the economy where there are large quantities of this type of firms.
The model is based on the industry average cost segmental matrix system, which is verified by the author based on data from all the 100% of Russian companies’ main branches of the presence of leadership strategies on costs in the period from 2003 to 2010 (the end of 2010 is taken analytically). The matrix is set out below: Table: Segmental matrix system industry average cost
![Table: Segmental matrix system of industry average cost [Alexander Shemetev]](http://content.snauka.ru/web/6009_files/t1.jpg)
The above matrix shows how many rubles and kopecks of each type of expenditure (expressed in thousands of rubles) are accounted for each thousand rubles of revenue of companies in the industry / for example, the 0.67128 for the cost in the A/Ccompanies mean that the 01 thousand (1,000) rubles 00 kopecks of revenue, on average in the industry, have 671 rubles and 28 kopecks of the total cost of production /. The only reservation should be done in service industries: there the greatest basis exists for the application of optimization transformations of financial reporting. The value of industry average costs by cost components for individual companies within the industry is calculated as follows:
![]() (7)
(7)
Where: β - is the coefficient of the position cost (eg, total costs or material costs), which was taken from the matrix for the industry in which the company operates and applies the cost leadership strategy. Rev - is the amount of revenue produced by company, which is then subdivided within the different elements; the revenue is then transformed into thousand rubles by the Kindex / everything is transferred into proceeds, because the cost is expressed in terms of revenue in the matrix system /.
K - is the conversion coefficient of revenue to thousands of rubles, which is calculated by the formula:
![]() (8)
(8)
Where: UM - is a unit measure of the currency in which your company is accountable (if thousands of rubles, then the UM index is 1,000, when millions of rubles, then 1,000,000). In the same way as it is performed for costs in formula (7), it is necessary to perform the calculations for the smaller components of costs like MC, SAS, OTA and so on, as it is performed in the example of calculations below.
The average industry structure of the Subject Company can be estimated with these figures, the figures with which one should compare your own or other legal entity under an analysis. If it is so that in your or another one company there is a situation when the costs of company under an analysis are higher than in average for this sector – it means the corporation under an analysis follows outside the costs leadership strategy and, therefore, it is a candidate to be rid of in a selected industry.
If it is so that the company under an analysis has the costs indicators lower the average in an industry, then such a company has all the chances and the potential to capture additional market shares, and it are analyzing, dear reader, of industry average costs are higher for this sector – mean that you are analyzing corporation departs from the strategy of cost leadership and is a candidate for disposal of the industry. If you are analyzing business system has lower unit costs than the industry average, then this company has the potential to capture additional market share and has a room for manipulation with the price, which is the main component of this strategy. Effect /which is a conditional, not actual value; and its need will be explained at an example! / from the application of the strategy will be calculated by the formula developed by the author of this paper (9):
![]()
Where: AI (sectoral, industry average) – these are the average in the industry costs indicators, which are to be recalculated for a company under an analysis by using the above formulas; F - these are the actual company’s under an analysis figures, which should be converted into thousands of rubles; COSTS - it is a total value of costs; MC - this are material costs; SOA - is the amount of social security contributions (assignments); AA - it’s depreciation (amortization); OTA - these are other costs; SAS – assignments to the salary fund; COSTS(AI) - means the amount of costs that would have an analyzed by you, my dear reader, company if it had the average in an industry efficiency; COSTS(F) - this is the actual cost, which occurred at the market for an actual company under your actual investigation; MC(AI) - is the amount of material costs, that would have an analyzed by you, my dear reader, company if it had the average in an industry efficiency; MC(F) - it is actually established by the market amount of material costs inside the business system under an analysis; SAS(AI) - these are actually formed in this period payments to the payroll of production workers at a company under an analysis; SOA(AI) and SOA(F) – these are social security contributions, which are respectively formed in a company in fact (SOA(F)), or which would respectively form in a company if it had the same efficiency as in average in an industry (SOA(AI)). AA(AI) and AA(F) - these are amortization fund payments, which a company would have deducted if it had the industry average performance (AA (AI)), and the norms of deductions, which the company is actually doing right now (AA (F)) /actually, in fact, it should have it done before the end of the reporting period/. OTA (AI) and OTA (F) - these are the value of other costs included in the cost structure of production, respectively, as it would be if the company had average industrial efficiency (OTA (AI)), and the actual state (OTA(F)). A positive effect size corresponds to the monetary amount that the company has in reserve as a basis for increasing the maximum cost of one component, which indicates a positive trend in the activities of the company. If you are counting as it is expected according to the method, ie, everything in thousands of rubles, then this amount will also be in thousands of rubles…
If you’ve transformed into other monetary units (starting from the matrix recalculation to the performance of the company you are analyzing), then if you calculate everything right, then the answer you will get in the same amount you provided your calculations. This figure can be viewed in the dynamics, which will give more complete picture of overall trends in the company and its development. The overall effectiveness of the company at the market will be calculated by the formula (10):
![]()
Where: TOTAL(eff) - is expressed as a percentage average of the more effective use of leadership strategies based on the costs minimization for the Russian company, expressed as a percentage. You can use the following indicator developed by the author of this paper to find a relative measure of company’s performance at the market (we have already counted an absolute indicator of efficiency), which shows the extent to which the average analyzed company can be successfully compared with its competitors (11):
![]()
Also, all the elements of material costs should be compared with industry averages, which would have the following simple algorithm. To calculate the efficiency of the total cost you should use the next formulas, developed by the author of this paper:
![]() (12)
(12)
![]() (13)
(13)
Where: EFF (COSTS) index will show the actual amount of money from the effect of company’s strategy in cost leadership. EFF (%(COSTS)) index shows the extent: to which interest the industry average for a selected company is more efficient than of its most part of competitors. Indicator of the effect of material costs will be calculated by the formulas, developed by the author of this paper:
![]() (14)
(14)
![]() (15)
(15)
Where: EFF(MC) index will show the actual amount of money from the effect of company strategy in cost leadership at the above mentioned component of costs.
EFF(%(MC)) index shows the extent: to which interest the industry average of this company is more efficient than among its competitors in the abovementioned indicator. Indicator of the effect of contributions on wages of production workers (payroll) will be calculated by the formulas, developed by the author of this paper:
![]() (16)
(16)
![]() (17)
(17)
Where: EFF(SAS) index will show the actual amount of money from the effect of company’s strategy in cost leadership at the abovementioned component of costs.
EFF (%(SAS)) index shows the extent: to which interest the industry average of this company is more efficient than among its competitors in the abovementioned indicator. Indicator of the effect of social security contributions should be calculated by the formulas, developed by the author of this paper:
![]() (18)
(18)
![]() (19)
(19)
Where: EFF(SOA) index will show the actual amount of money from the effect of company strategy in cost leadership at the abovementioned component of costs.
EFF(%(SOA)) index shows the extent: to which interest the industry average of these companies is more efficient than of its competitors in the abovementioned indicator. Indicator of the effect of depreciation should be calculated by the formulas, developed by the author of this paper:
![]() (20)
(20)
![]() (21)
(21)
Where: EFF(AA) index shows the actual amount of money from the effect of company’s strategy in cost leadership at the abovementioned component of costs. EFF(%(AA)) index shows the extent: to which interest the industry average of these companies is more efficient than of its competitors in the abovementioned indicator.
If the figures of depreciation (AA) are above the industry average depreciation, then, dear reader, think: maybe it makes sense to use a non-linear method of depreciation… Let’s suppose it is much harder, at the same time, it may be better, because in this case the property will bring major cost of depreciation in significantly faster manner, and in the short term it will be to lower the actual linear rate of depreciation, therefore, it can help the company to adopt a strategy of cost leadership in a more successful manner…. It all depends on the internal examination of the particular company and on whether you can convince your accountant to spend a significant amount of extra time and effort to change the accounting principle…. Indicator of the effect of other payments will be calculated by the formulas, developed by the author of this paper:
![]() (22)
(22)
![]() (23)
(23)
Where: EFF(OTA) index will show the actual amount of money from the effect of company strategy in cost leadership at the abovementioned component of costs. EFF(%(OTA)) index shows the extent: to which interest the industry average of these companies is more efficient than among its competitors in the abovementioned indicator. Let us, for clarity, consider the following example. Co Ltd “Kama” is specializing in the production of premium sort grain, and it adopts a strategy of cost leadership (and, therefore, the price leadership); the company has the following performance measures: revenue per year: 100 million rubles. Cost per year of 65 million rubles, Including material costs: 40 million rubles, Payroll (labor costs): 10 million rubles, Social deductions in 2 million rubles, depreciation: 4 million rubles, and other costs: 9 million rubles. For simplicity let’s assume that these indicators are already counted with the actual accuracy to a penny.
Let’s calculate the effectiveness of leadership strategies based on the costs leadership for the company. First, let’s compare the activities of a company with an industrial branch of activity from the scheme above. It is clear that it would be agriculture. Now we calculate the K index. Since the company uses calculus in millions of rubles in reporting, the index is equal to 1.000.000/1.000 = 1.000. Let’s recalculate all the figures in accordance with the coefficient K: Revenues for the year: 100,000 thousand rubles. Cost per year: 65,000 rubles, including, material costs 40,000 rubles, Payroll (labor costs): 10.000 rubles, Social deductions: 2,000 rubles; depreciation: 4,000 rubles, and other costs: 9,000 rubles. Now we should use the coefficient β of the above formula, which will transfer the activity of the analyzed company into conventional activities: such as if it worked exactly in accordance with industry standards:
![Now we should use the coefficient β of the above formula, which will transfer the activity of the analyzed company into conventional activities: such as if it worked exactly in accordance with industry standards: [Alexander Shemetev]](http://content.snauka.ru/web/6009_files/e1.jpg)
The calculated values show what would be the cost structure of company at the market, if it had the industry average profitability. It should be noted that if the statements of the company has a value measure in thousands of rubles, the cost averages can be calculated to within cents. In this example, the goal of ideal accuracy is not placed, because the data have been rounded. Now let’s calculate the monetary value for the effect of the use of leadership strategies on costs:
![Now let’s calculate the monetary value for the effect of the use of leadership strategies on costs: [Alexander Shemetev]](http://content.snauka.ru/web/6009_files/e2.jpg)
What does this quantity perform? It shows just how much better are the company’s activities in terms of money per lumped component costs, taking into account the structural component. This is a conditional value, not an actual one. The overall effect of the application of leadership strategies based on the costs for Co Ltd “Kama” is
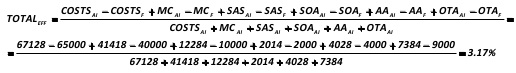
The company “Kama” is 3.17% advantage over industry averages for cost leadership; it is an important indicator for the business systems that use the specified policy of positioning in the market segment. This figure could turn out negative … and that would mean that perhaps the company should position itself not as a “leader in cost” in order to maximize turnover, and in some other way… Maybe it should try a strategy of positioning its products (differentiation) by, for example, quality, or to diversify its production (it to be ‘sprayed” into many small components; an example of diversification: the company was selling chicken carcasses, and after it began selling smoked hen, chicken sausages, baked hen, …. .), or to do something else, and it is likely to deviate from this strategy, of course, if there is no real possibility in the near future the drop the products price down. Let us, together with you, calculate the other comparable figure of the effect:
![]()
This indicator is relative, because the cost is laid in it twice (total and within components). It is intended to compare the company with its direct competitors, because this figure, in contrast to the overall efficiency, puts more stringent conditions: whether the company can cover the cost by its reserve for more than two times or not! If it can at a sufficient level – the cost leadership strategy can be applied for such a company – moreover, this is, most probably, the strategy that the company needed. The sufficiency level should be estimated by comparing the company under an analysis with its direct competitors by the same formula, which calculates the efficiency.
If the level is insufficient – you, my dear reader, should ask yourself a question: if we can also look for a different strategy in positioning its products on the market? The company has this figure turned low, only 1.09% of the benefits! Quite possibly, it either should seek additional strong reserves to reduce production costs (for instance, by growing the grain of non-premium class), or to change its strategy for differentiation or costs-leadership-diversification; for example, by going directly to consumers through a network of millers and bakers shops, which could differentiate its production by selling cheap bread and pastries or bread-stuffs, which could or would be a continuation of the strategy of cost leadership or differentiation strategy (eg if the bread and pastries will go of a different quality, assortment (cakes, pastries, white and black bread, biscuits, sweet pies and so on).
If the average cost of grain is higher in a selected area or region, than average in Russia (for example, grain production in the far north regions (eg, Yamal-Nenets Autonomous District)), it is possible that the specified rate is good enough for the implementation of the cost leadership strategy. It can be found by direct comparison of the company you are analyzing with the competition environment. As these examples are more the exception than the rule, therefore, in such case, there are not many competitors in the region, that is why the market analysis should not take much effort. It should also be taken into an account: the possibility of entering at that market segment the competitors from other regions in which the figures can be close to the industry average! You should also calculate other performance indicators for company at the market:
![You should also calculate other performance indicators for company at the market: [Alexander Shemetev]](http://content.snauka.ru/web/6009_files/e5.jpg)
![You should also calculate other performance indicators for company at the market: [Alexander Shemetev]](http://content.snauka.ru/web/6009_files/e6.jpg)
These calculations indicate that a company, as a whole, has the ability to use cost leadership mostly due to savings on salaries (23%). Other indicators of effect, on average, are “eaten” by too exaggerated proportion of “other costs”. The above demonstrates that the company is not yet ready to make a strategy of cost leadership! This policy of positioning products in the market requires special cheap manufacturing technology, not just salary savings! Company needs to upgrade the technology or to make the production of grain using a cheaper technology, or switch itself to a different strategy, that is, the positioning of products (differentiation), which I, together with you, dear reader, will consider in the future. By the way, please, do not forget that the specified model should look at the dynamics in order to know on what are the trends in the company’s development! We have examined a model developed by the author of this paper of mono-parametrical segmentation of the Russian company in the market. We have examined segmental matrix system of industry average costs. You probably ask me: “And is it all for companies which use a strategy of cost leadership in the market or not?”.
My answer would be: “Actually, no”. Firstly, the technique itself is to be used not only for companies which use the cost leadership strategy, and also for other companies because the cost – it is an important (with the exception that is not the only) quality indicator also for a model of differentiation. This matrix is useful for calculating the companies, primarily producing more or less uniform and comparable to the industry average production. Other companies may simply compare themselves with industry averages. Secondly, this technique is designed to analyze the company’s strategy and cost leadership adequacy from the inside …. – in order to have a complete picture about the situation in the market – a company must also know the position from the “outside”, ie, at the market. This is the way we are going to follow with you, dear reader, now. Alexander Shemetev’s model: Segmental model to estimate the position of Russian companies at the market Generally, what is a comparison of one company with another? What is the comparison of company with the market in which it exists?
In a typical embodiment, it is a comprehensive comparison of company’s basic elements with other companies. It is in normal form. There, in any case, a model should be created, – a model with the set of evaluation parameters: it is not important, external or internal this model is relative to the target firm – all the same: at least a few parameters should be taken. And here’s the model of leadership at costs, which has it in another way …. There is only a single internal and most important parameter which estimates the efficiency: the cost and price of the finished commodities! All other parameters should not be important for this kind of policy of the firm, otherwise, it’s a different strategy…. When evaluating a business system in the environment all at about the same: only one important parameter, which is already associated with volume of sales: revenue!
The second direction of leadership on costs strategies which is directed outwards, is expressed in …. maximization of trade, that simply puts the company’s revenue …. How to evaluate: whether the current level of revenue is sufficient for the satisfaction of certain corporations according to the mono-parametrical model? It possible and, even, it is necessary to rate it. My dear reader, please, note that we are not talking yet about the profitability or the structure of the book value of a company – just about asset turnover, about an index, maximization of which is the goal of an average company in the market from a position of cost leadership. The more efficiently the company carries this goal out, the more effective it is fighting against competitors. Other analysis, for business systems of this strategy, is secondary – you, together with me, will see its algorithm a little later. In the meantime, let’s analyze the segmental matrix system of the cost-leadership-strategy of company positioning at the market on the company’s turnover indictors:
Segmental matrix system of the turnover of capital of Russian companies
in average in the industry
![Segmental matrix system of the turnover of capital of Russian companies in average in the industry [Alexander Shemetev]](http://content.snauka.ru/web/6009_files/t2.jpg)
Where: Rev - Revenue sum for the reporting period; OC(Eq) - the total book value of owned capital (equity); TAS - total balance sheet sum (company’s book value sum); TL - total liabilities” sum; AP - accounts payable; AR - accounts receivable. A/C , FEC-1and so on – are the names of the industries, which are given above. The above matrix was compiled and developed by the author of this paper based on an analysis of 100% of the companies of mentioned sectors in the Russian Federation from 2003 to 2010 (the end of 2010 is taken analytically). The above matrix characterizes the average turnover of capital of companies of listed industries (transcript of the names of industries cited above). It can be seen from the scheme that the minimum capital turnover is typical for companies involved in mining and processing of fossil fuels and minerals sectors, as well as real estate, agriculture, wood industry and metallurgy with its attendant sub-branches. The maximum capital turnover is associated with the sphere of education, as well as retail trade and wholesale trade, textiles and food, printing and publishing sectors.
These production types undertakings constantly brings to its owners a “live revenue”, which can be crucial to long-standing cycles of production and industrial companies (in case of diversification of their activity). I’d like to make a reservation for one type of industrial companies: of the agro-industrial complex (AIC). As it can be seen from the scheme, agriculture has a very low turnover of capital and the scope of food supply – has it moderately high. The average asset turnover for AIC companies (that combines production and processing of products) is about 1, that is, revenue at them is comparable to the amount of assets. We must now return to the analysis of a company in the market, whose market policy position is cost leadership. The purpose of such company as you, dear reader, remember, is to maximize the rate of business turnover / revenue sum related for any indicator /. Let us compute the external effects of leadership on the costs policy for business-system for a certain branch (internal effect, as you, dear reader, remember, is associated with the minimization of costs, which we have analyzed earlier). The total external / market / effect of the use of cost leadership strategy for domestic companies is (25):
![We should now find the value of correction factor in the micro-segment, Ar: [Alexander Shemetev]](http://content.snauka.ru/web/6009_files/e25.jpg)
This indicator is an upper threshold of performance. The overall effect of accounts receivables and payables management policy is directly related to the maximization of sales:
![MicDy – is the market share, calculated at the rate per one year. [Alexander Shemetev]](http://content.snauka.ru/web/6009_files/e26.jpg) (26)
(26)
Where: (Rev/TAS)f and (Rev/TAS)ai- are, respectively, actual and average in an industry / taken out of the matrix system / assets turnover; (Rev/ OC(Eq) )f and (Rev/ OC(Eq) )ai - are, respectively, actual and average in an industry / taken out of the matrix system / equity turnover; (Rev/TL)f and (Rev/ TL)ai - are, respectively, actual and average in an industry / taken out of the matrix system / total liabilities (borrowed capital) turnover; (AP/AR)f and (AP/AR)ai - are, respectively, actual and average in an industry / taken out of the matrix system / accounts payables and receivables ratio. Along with the overall effect, it should be calculated also the private effect of applying by a company this strategy of leadership in cost for each indicator. In terms of total asset turnover it is calculated in the following way:
![For our example, the share of other companies in the market segment is in absolute values: [Alexander Shemetev]](http://content.snauka.ru/web/6009_files/e27.jpg) (27)
(27)
In terms of OC(Eq) turnover, effect is as follows:
![]() (28)
(28)
In terms of TL turnover, the effect is:
![For our company, the shares they occupy in the sub-segment of the consumer market’s micro-segment are: [Alexander Shemetev]](http://content.snauka.ru/web/6009_files/e29.jpg) (29)
(29)
The average of these three variables (EFF(M(TAS)), EFF(M( OC(Eq) )), EFF(M(TL))) - is a lower threshold of performance for successful in this strategy companies. Let us consider, for illustration, the following example. Let all be the same: same Co Ltd “Kama”, which has revenue of 100 million rubles and applies a strategy of leadership in cost, has the following balance sheet indicators: OC(Eq) = 70 mln., TL = 50 mln., TAS = 120 million rubles; AR = 30 mln., AP = 28 million rubles . Let us compute the external effects of its operation at the market: ![Let us compute the external effects of its operation at the market: [Alexander Shemetev]](http://content.snauka.ru/web/6009_files/e7.jpg) Thus, the position of the business in company is so, that the products have quite a high demand, which gives about 51% greater effect of capital turnover of the company than of the average company (plus 51% to the same indicators to the situation if the company worked with average in the industry ratios). The above means that the situation in the market is favorable for the application of strategies based on costs leadership. However, as we established earlier, the internal cost structure has not yet involved the use of the above mentioned policy of positioning of the goods; it is clear that the re-organizing of production in order to minimize costs may have good reason for a company. It should also be evaluated other performance indicators for business systems on the market:
Thus, the position of the business in company is so, that the products have quite a high demand, which gives about 51% greater effect of capital turnover of the company than of the average company (plus 51% to the same indicators to the situation if the company worked with average in the industry ratios). The above means that the situation in the market is favorable for the application of strategies based on costs leadership. However, as we established earlier, the internal cost structure has not yet involved the use of the above mentioned policy of positioning of the goods; it is clear that the re-organizing of production in order to minimize costs may have good reason for a company. It should also be evaluated other performance indicators for business systems on the market: ![It should also be evaluated other performance indicators for business systems on the market: [Alexander Shemetev]](http://content.snauka.ru/web/6009_files/e8.jpg) This ratio shows that the ratio of the company’s accounts payable and receivable is lower than the industry average, which gives some reserves in an amount comparable to the 23.2% for the manipulation of credit policy / debt management / in the company. The above ratio is likely a reference indicator. However, exceeding the industry average figures can be detrimental for a business system (in this case, the ratio would have turned out negative). You should also calculate other indicators:
This ratio shows that the ratio of the company’s accounts payable and receivable is lower than the industry average, which gives some reserves in an amount comparable to the 23.2% for the manipulation of credit policy / debt management / in the company. The above ratio is likely a reference indicator. However, exceeding the industry average figures can be detrimental for a business system (in this case, the ratio would have turned out negative). You should also calculate other indicators: ![You should also calculate other indicators: [Alexander Shemetev]](http://content.snauka.ru/web/6009_files/e9.jpg)
That is, on average, each performance indicator demonstrates the effectiveness of 34% on average. It should be noted that overall performance has turned out more than 51% due to the fact that the efficiency ratio’s denominator has not actual figures, and averages in the industry, which for a successful cost-leadership company must be lower than actual, which, in its turn, therefore, raises the effect. This effect means, that the company sells an average of 34% – 51% more output from the calculation of the size of the book value than the industry average competitor, if he had a similar book value.
The advantage in this indicator means that a company may adopt a strategy of cost leadership due to the fact that the sales volume of such company, therefore, the market share is significantly higher than the industry average. The said method can be applied to other companies, employing non-cost leadership strategy. It is good to apply this method to see the trends of company’s development.
Thus, we with you, dear reader, considered developed by the author of this paper methods of how to segment the domestic companies, especially those that use the cost leadership strategy. Let us now consider how we can segment the companies using different strategies. Leadership Strategy for the position (differentiation) suggests that a certain company produces a product that should be allocated in the positioning and be notable among competing products. How can somebody stand out among the products of competitors and what do these products and competitors? Probably, most successful answers were given by Michael Porter (M. Porter, 2006), the answers to the whole set of questions about products, competitors and manufacturers. He brought the theory of five forces that influence to the company positioning at the market: the strength of competition of direct competitors that seek to capture the market; the competitive strength of potential competitors, including from related industries who seek to enter the market; the strength of cooperation with potential partners and real companies (suppliers, dealers, banks, …); the strength of cooperation with clients; the strength that comes from challenge from substitute products in the market.
![]() Substitute product – is a product which, because of its special qualities and characteristics to consumers, is able to partially or completely fill the need for clients in a particular type of goods, works or services. For example, the video recorder can be completely replaced by DVD-player. Video recorder can be partially replaced by computer and more partially – by palmtop. Sometimes we can meet rare species of goods at the market for which there are practically no substitutes, such as salt.
Substitute product – is a product which, because of its special qualities and characteristics to consumers, is able to partially or completely fill the need for clients in a particular type of goods, works or services. For example, the video recorder can be completely replaced by DVD-player. Video recorder can be partially replaced by computer and more partially – by palmtop. Sometimes we can meet rare species of goods at the market for which there are practically no substitutes, such as salt.
A different set of answers to questions about how products can stand out among their own kind, perhaps, more successfully was managed to bring by the first classic of marketing: Philip Kotler (Ph. Kotler, 2008). He and his followers believed that the basis of demand for the product itself is the end user, which can be either a series of industrial companies, or individuals. In the case when customers are private individuals, in this very case, the product should be allocated by the regional (for example, to turn up the place in a good region, to put a store in the city center, or vice versa, on the outskirts, to calculate the effect from local outlets, ….), demographic (for example, to produce goods for men only or for women only, only for kids, only to married couples, for families of class A and so on ….), psychographic factors (for example, to create fashion for the goods, or a fashion trend, to rearrange the goods at the “rails” like goods to snobs, to investigate the psychological types and consumer groups, which will be expected to buy a certain sort of goods, and so on). If the market is concentrated to industrial cunsomers, the groups of factors, in this case, becomes more than three – more precisely – five: microenvironment (the economic sphere and the economic sector, company size, geography, points of production and marketing, … ..); the internal environment (technology, sales and delivery , the structure of financial flows, the orientation of marketing-management, staff motivation, ….); the overall commercial relationship between each customer and the producer (the presence of purchases and sales centers, responsibility centers, the procurement criteria themselves, purchasing additional conditions and other factors); private commercial relations between each consumer and producer (urgency, lot and order sizes, quality, delivery and payment conditions, ….); the internal psychological characteristics of managers of clients-firms with whom the company maintains close working relationships.
I hope I was able to answer your questions as to what differentiation strategies are common features for the companies whose clients are private individuals or even business-systems. We can now proceed the consideration of issues related to the manner in which to segment the Russian companies using these positioning strategies of the goods at the market. As you may remember from the scheme, the author of this paper developed two models, which allow to segment this type of firms at the market: factor model and multi-segmentary model, which consists of models of multi-segmentary analysis of consumer and of multi-segmentary analysis of market itself.
Alexander Shemetev’s model: model of factor segmentation of Russian companies at the market
The worldwide used today factor model – it was originally Russian development. The founder of the method, Mr. Kriylov (Kriylov, 1906, 1918), was once thinking about how to assess a new man-of-war (military ship), if it is only known this new ship is better than the old one. Military ships at those times in Russia just came from made of wood man-of-wars to the heavy ironclads (it was 1903).
Each heavy ironclad had thousands of important components – there were no computers at those times to estimate each of them – so the problem on how to estimate a new heavy ironclad that consists of thousands of new details was almost an un-decidable arithmetic no one could calculate. At least, in 1904 he started to follow this way and tried to calculate the cost of only one new heavy ironclad. A year after he understood it is useless to make such like deep calculations, to spend too much time and recourses with no result at all: for the whole year he couldn’t find a cost of only one new heavy ironclad, and, of course, the problem on how to estimate many new heavy ironclads was irresolvable and impossible to be calculated. He understood there were too many details to be gathered together for the analysis. And in 1906 he put forward the revolutionary proposal: not compare the extent to which one part is better or worse than another one, and to compare the parameters themselves /that today would be called: “marketing product parameters”/, which primarily evaluated the battleships: the thickness of armor, speed, agility, tools, metal consumption in production and so on. Unfortunately, this method wasn’t used I Russia: in 1906 Russia suffered of the first attempt of revolution, then the First world war and the second Russian 1917th revolution.
The revolution of 1917 ousted the method to be used on a single shipbuilding yard: in St. Petersburg, where it was applied. In 1917th Mr. Kriylov immigrates to the West, where, in the U.S. in 1918 for the first time, this method became widely known to the public. Large U.S. companies gradually adopted this method to be used. Late 1930s – early 1980s was the “finest hour” of this method: the world’s largest business giants adjusted their models for this method: not only in pricing as it was before 1930th – they started to use it for the market segmentation to compare the advantages of each company among its competitors. Each company then developed its own mathematical model of market segmentation on the basis of the Kriylov’s method. The method has three equivalent choices: multi-matrix, petal, and web-analysis (arachnoid, and not the internet!) – from the names of which there are two types of diagrams: the Arachnoid diagram and the petal diagram. The crisis of the mid-80s, as well as some of the earlier crises in developed countries, showed that the company may actually be competitive in the face of all the competitors, and in fact, be declared bankrupt (such as the construction company of William Stern, a corporation of hospitality (hotels and restaurants) industry of Harvard graduate Jacques Borel who used these methods).
Thus, large companies began to move away from this method in favor of a cluster analysis of the market. However, this does not mean that the method is not used at all – it is used by virtually all major companies in the West, not just as the only method of evaluation of segmentation in the market. The value of this method is great: for the first time it managed to oust from the use the mass-marketing method / targeting only internally to the company itself and its ability to produce production for mass consumption without differentiating the properties of finished commodities/, which was very common in the early twentieth century. This method also increased much the technical orientation of the production and, due to this, we can now easily buy commodities with highly developed technical parameters, which is an important part of out today life.
Adaptation of this model of market segmentation for the use in Russia, unfortunately, has been neglected – the method was seen as mainly theoretical for price-making. The author of this paper has tried to adapt this method for use in Russia for market segmentation. The author of this paper believes that market segmentation can be done by dividing the production activity in certain product lines, which can be compared with the same indicators of competitors. The aim of the method of calculation should be the total score of the effect of each production line of products. Under a line of products can be understood any comparable output; the product should be comparable within the same products and obviously different from consumer characteristics of other products produced by company. Each such product has significant consumer characteristics on the important parameters.
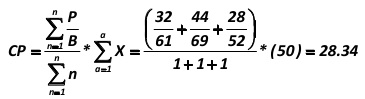
There are three types of factor models that are suitable for the segmentation of domestic companies on the market: scoring model, point-weight model and the regression model. Let’s examine them in more detail. The use of scoring models for the segmentation of the Russian market Scoring model assumes that the main characteristics of goods in the production lines are already set in the market for this reporting period, and that each characteristic is equivalent with respect to other characteristics. Then compare the resulting characteristics of the amount of points can be carried out through qualitative characteristics: a fair price or a comparable price.
It should be noted that the fair and the average price for a company may be different from the market. The fair price of the production line – this is the actual amount of the valuation of all the useful features included in the product line at a market value except for the price itself. The comparable price – is the actual amount of the valuation of all the useful characteristics of the product, including the market price. The comparable price for a unit of conventional product (ComP), a member of the company’s product line is:
![The comparable price for a unit of conventional product (ComP), a member of the company's product line is: [Alexander Shemetev]](http://content.snauka.ru/web/6009_files/f30.jpg) (30)
(30)
Where: ComP - is the theoretical value of the average cost of one point on the parametric range of products in terms of money. P - is the average price of the product line items of a competitor in the market. ΣB - a score line of products for products of some competitor at the market. n - is the number of competitors for this product line at a market. a - is the the total number of points that are scored on the same index by a production line at the market. X - is the average score for a production line product. Fair price (FP) for conventional production units will be assessed as follows:
![Fair price (FP) for conventional production units will be assessed as follows: [Alexander Shemetev]](http://content.snauka.ru/web/6009_files/f31.jpg) (31)
(31)
Where: ΣB (Pr) - is the sum of the points on the line products on the market of a some competitor, expressed as in the assessment of points on the price of the commodity itself. X (Pr) - is the average score for a production line product, estimated at the price of the goods.
To simplify the perception of sign of the sum (Σ) in front of B, there will not be put in front of B in the future, so, dear reader, just be aware, that this is already included in the calculations. For a more visual representation of the method, let us consider the following example. Company Co Ltd “Ugra” produces two product lines (two types of goods on a single line of output): curds (“Normal” and sweet curd called ‘snowball”) and dairy products (milk called “Normal” and ‘skim rustic” milk (SRM)). For simplicity, suppose in each line there are only two of the above products. Imagine that a company has three competitors (C1, C2, C3) on each line. The method of market research established the following characteristics of cottage cheese:
Table: Estimated characteristics of the curds at the market
![Table: Estimated characteristics of the curds at the market [Alexander Shemetev]](http://content.snauka.ru/web/6009_files/t3.jpg)
![]() Comments to the Table: 1 U.S. dollar is circa 30 rubles.
Comments to the Table: 1 U.S. dollar is circa 30 rubles.
It should be noted that not in all cases the calculations should be based on comparable prices in the analysis, especially if the price per unit of product is too high, which will absorb the significance of other factors. However, even at a high price – the comparable price will stay a comparable a factor of comparison with the competition environment, simply the significance of analysis may be lost in this case – that is why it is better to use a fair price analysis.
Analysis at a comparable price is able to take into consideration the market price as a parameter, when it is not estimated with the use of some regression model (due to a complexity of mathematical model in this case). Comparable price makes the specified form of analysis applicable to estimate the production unit which sum of “weight” scores is not too big, at least, roughly, less than the sum of points for the highest quality product on the market. If the total score is significantly less than the market value per unit of output, then the analysis should be used at fair value. In more simple language you, my dear reader could easily understand what is the comparable value, we can’t compare, for instance, a package of curd that weight if 300g with the package of curd produced by some competitor who put its curd into a 1 kg package – the price per package should be comparable.
The weight – is not the only parameter that differs one product from the other one, there can be tens or even hundreds of important for customer parameters that should be estimated; besides, weight parameter is usually estimated at price parameter prior to the analysis itself, because its significance can be expressed through comparable with the other products at the market segment prices. Dear reader, please, note: comparable commodity’s value (price), as we shall see from our example, is not a method to make conclusions about the fair prices on some kind of commodity at the market – it just is a tool to compare goods on both price and quality characteristics.
Fair price, in a simple language, is a situation when the sum of scores for a certain product, for instance, a curd, is estimated at a market price without it to be too much high or too much low – these products should be analyzed in a special way in this kind of analysis or replaced to be used in another group for an analysis. Thus, it is seen the “Normal” and ‘snowball” products have serious competitors.
How to assess the competitiveness of the production line at the market? How to dete RMI ne the quality of that segment, which has the conditional Company “Ugra”? Let’s use quality characteristics. Let’s calculate the price of a comparable product with the properties that we were able to compare within this product line competitors. First, we calculate a comparable price for the ‘snowball”:
![First, we calculate a comparable price [Alexander Shemetev]](http://content.snauka.ru/web/6009_files/e10.jpg)
The comparable price for curd “Normal” is:
The comparable price for cottage cheese “K1″ under given conditions is as follows:
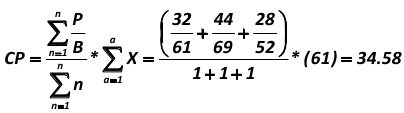
Similarly, we dete RMI ne that a comparable price for curd C2 is 39.11; and for curd C3 – 29.47.
These costs are in rubles. It can be seen through the comparable value that the ‘snowball” surpasses all similar products and that the main competitor for it – is a curd C2, with whom they share the main market segment of high-quality curd-cheese. However, one shouldn’t draw conclusions about whether the price is acceptable on the basis of comparable value. A comparable value is intended to show the products of competitors in both price and quality characteristics, so that products can be compared with each other.
Another method to dete RMI ne a company’s competitiveness in the market is a method for dete RMI ning fair value. For the curd-cheese ‘snowball,” this figure will be:
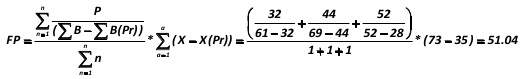
The price above reflects the fair market value of all the taken into account qualitative characteristics of cottage cheese ‘snowball”. Similarly, it’s easy to calculate the fair value for curd “Normal” – it is 37.61 rubles; comparable to the fair price for cottage cheese “C1″ is 38.95 rubles; comparable to the fair price for cottage cheese C2 – 33.58 rub.; comparable to the fair price for cottage cheese C3 – 32.24 rubles.
Now, let us estimate the second line of products of Co Ltd “Ugra”, milk. Marketing research methods established following characteristics of milk for these companies at the market:
Table: Estimated characteristics of the milk at market
![Table: Estimated characteristics of the milk at market [Alexander Shemetev]](http://content.snauka.ru/web/6009_files/t4.jpg)
Since the mechanisms of the calculations were already analyzed, let’s just imagine the calculated data for milk in the table below: Table: Competitive characteristics of the milk at market
![Table: Competitive characteristics of the milk at market [Alexander Shemetev]](http://content.snauka.ru/web/6009_files/t5.jpg)
It should be noted that in some cases the volume of container can be included in “other factors”, although it can also be used in the main (through a comparable by volume price). Now let’s estimate the company’s competitiveness at the market for scoring models. Competitiveness of the company by the method of comparative prices has the next appearance:
Arachnoid Chart: Competitiveness of the company “Ugra” in the market, dete RMI ned by the method of comparable rates
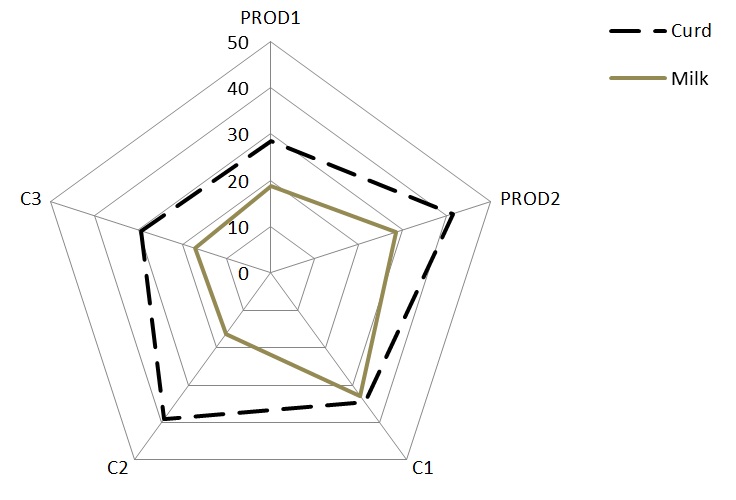
Comments to the chart: ![]() PROD1 and PROD2 at the chart – are the conditional abbreviations for Product 1 and Product 2 for milk and curd;
PROD1 and PROD2 at the chart – are the conditional abbreviations for Product 1 and Product 2 for milk and curd; ![]() The chart is estimated in comparable prices in rubles. As it can be seen from the graph, company “Ugra” has a good market competitiveness. It is important also to dete RMI ne the company’s competitiveness at the market by a fair price:
The chart is estimated in comparable prices in rubles. As it can be seen from the graph, company “Ugra” has a good market competitiveness. It is important also to dete RMI ne the company’s competitiveness at the market by a fair price:
Arachnoid sector chart: Competitiveness of the company “Ugra” at market, defined by the fair price
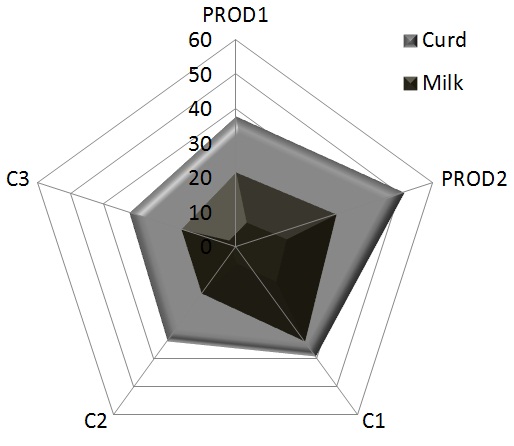
As you, dear reader, may see, there are two main competitors of Co Ltd “Ugra” in general comparable and quality characteristics: C1 in milk and C1 in curd. Co Ltd “Ugra” has the leading segment of the market at curd and milk production, at the same time, perfo RMI ng the price differentiation strategy by sharing the products on cheap with sufficient quality and more expensive with high consumer properties.
There is a more demonstrable way to represent the volume of segment of the market by company’s competitiveness index at the market. For these purposes, the fair or comparable price for the main line of each type of product (it can be chosen the most competitive product on each line) should be transformed according to the following formula, developed by the author of this paper:
![There is a more demonstrable way to represent the volume of segment of the market by company's competitiveness index at the market. For these purposes, the fair or comparable price for the main line of each type of product (it can be chosen the most competitive product on each line) should be transformed according to the following formula, developed by the author of this paper: [Alexander Shemetev]](http://content.snauka.ru/web/6009_files/f32.jpg) (32)
(32)
Where: CCPAI - this is an aggregated index of competitive product lines to competitors in the market comparison; FCP - it’s a fair or a comparable product price, depending on the method chosen; A - is the best chosen for the analysis product among the company’s lines and its competitors (the “best” may mean maximum scores, or any other product you wish to compare with the other products); i - is the i-th product of a product line of the company and its competitors, which occupy a similar market segment. So, if we transform the competitiveness indicators of the “Ugra” company in accordance with the above formula, we obtain:
Table: The competitiveness of the “Ugra” company at the market, dete RMI ned by the method of comparable price
in relation to the standard product line
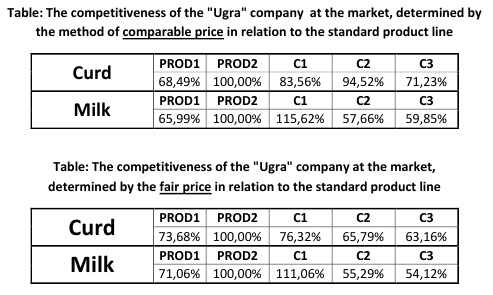
The rebuilt Arachnoid diagram s for these indicators are able to demonstrate the company’s competitiveness in the market segment relative to the reference product for which it should be noted, or it can be taken any specific product lines to analyze. These figures show the percentage of lines in other products differ of competing companies and other internal lines of the company in relation to the reference product.
However, the method of dete RMI ning the market segment and the company’s competitiveness at the market by the scoring model has some drawbacks. Among these major shortcomings should be noted that the points, which are earned by various characteristics, are considered fully comparable and equal for the market consumption. Thus, in the example above, the scores for the fat content of milk were compared with scores on time till expiration date (for each 1 day 1 point was put) and with scores on the design, expressed in 10-point system of measurement. However, not all these properties can be equivalent for the consumer: she or he gives some more properties, gives more preference to one products more than the others.
If this deficiency is essential for production, and it can’t be eliminated within the above method, it may have value to use a different method like point-weight model to dete RMI ne the competitiveness of the market segment of company. The use of point-weight model for the segmentation of the Russian market The model also assumes that the company produces the same type of production lines. However, as noted earlier, the company may belong to any industry and any method of production – it is important that a set of products, which are included in the line, was qualitatively comparable.
The difference between this model and the previous one is that the scores on the parameters of the line products are not equal, and they are amenable to mathematical discrimination. Another difference between this model and the previous method is the lack of a regression function of the price, knowing that abstraction is taken, according to which the price is not a factor which is derived from the internal characteristics of products available in the market. Thus, these abstract “brushes aside” the possibility of applying the method of comparable prices. Assessment of the company’s competitiveness in the market and the adequacy of its occupied segment is dete RMI ned by calculating a fair price, which is designed to dete RMI ne: whether the manufacturer’s price for the continued development of line of products is adequate in the segment for the given parameters of significance. A fair price for the product line (FPi) is:
![A fair price for the product line (FPi) is: [Alexander Shemetev]](http://content.snauka.ru/web/6009_files/f33.jpg) (33)
(33)
Where: ΣBk – is a score estimated at the rate for one production line of the analyzed company with taking into an account of the particular importance of each component; n – is the number of competitors, P – is the price per unit of output; ai – is the importance of the i-th parameter, described as significant in the conducted market research; Bi – is a score of the i-th factor, which is included in the calculation of this model.
Let’s take an example from another industry: the automotive industry. Let there is some conditional Opened Joined Stocks Corporation (OJSC or Public Corporation) “NTAZ”. It has two main production lines for the production of cars P1 and economy class car P2. The company competes with three competing products in this market segment: K1, K2 and K3. The method of market research established the following data:
Table: Competitive characteristics of the lines of “NTAZ” at the market
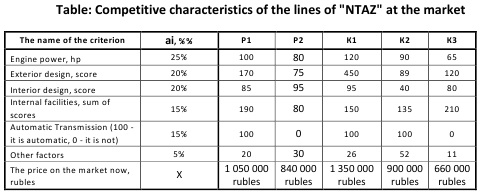
Comments to the Table:
![]() ai - is a conditional abbreviation for Importance of the criterion, calculated in relative density
ai - is a conditional abbreviation for Importance of the criterion, calculated in relative density
Let’s calculate the fair value for P1:
![Let’s calculate the fair value for P1: [Alexander Shemetev]](http://content.snauka.ru/web/6009_files/e14.jpg)
Let me remind you, my dear reader, the figures 120,5; 177,8; 86,15; 88,3 – are received as a sum of scores weighted to its ai for each important component. Similarly, we can calculate a fair price for a line of P2 and for competitor’s productы: K1, K2 and K3. We will not dwell on it, knowing that this is already included in the calculation. Results of calculations are presented in the following Table:
Table: Qualitative characteristics of the lines of “NTAZ” at the market
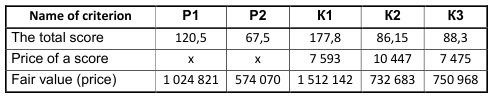
You’re probably asking the question now: why the calculation of fair value does not include the points P1 and P2, produced by JSC “NTAZ”? Therein it lies the essence of segmentation and dete RMI nation of a company’s competitiveness in the market: in dete RMI ning whether the product market conditions adequately estimate its monetary price! The above analysis can result in performance of different companies at a fair price, which is creates the opportunity to adequately compare the company’s production lines; and it gives the opportunity to adequately dete RMI ne its actual competitiveness. Arachnoid diagram of JSC “NTAZ” competitiveness is shown below: Arachnoid-sector chart: Competitiveness of JSC “NTAZ” at market, defined by the fair price
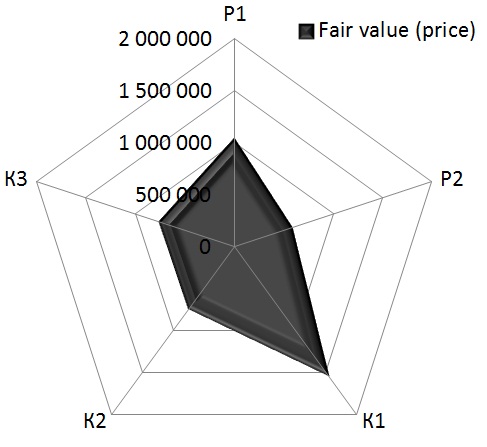
The fair price of products of JSC “NTAZ”, especially of the products from the line P2, is less than the market fair price, which says that the company is losing competitiveness in the market segment, and it can soon begin to lose its occupied segments in the market, if the price of goods or its qualitative characteristics will remain on the same level at parametric series. Earlier we discussed with you, my dear reader, the method of dete RMI ning the deviation of the fair price of the goods, when the product was taken at the reference of one of the production lines of the analyzed companies in each direction. Along with this, there is an analysis method for the dete RMI nation of the absolute deviation from the standard market rates.
This method was proposed by the author of this paper. The analysis is carried out by the fact that the standard is taken de facto a leader of the market: no matter whether an item belongs to specified lines of the analyzed company or not. The transformation takes place in accordance with the formula, developed by the author of this paper:
![The transformation takes place in accordance with the formula, developed by the author of this paper: [Alexander Shemetev]](http://content.snauka.ru/web/6009_files/f34.jpg) (34)
(34)
Where: C(%) – this is expressed as a percentage measurement of the magnitude of the effect on the position of a particular i-th product at the market; FPi – it’s a fair price of the product, and A(A) – is a reference product at the market, which has the highest quality specifications.
Transforming the data for JSC “NTAZ” in accordance with the above formula, we will receive the following information on the competitive position of firms in the market segment: Table: The competitiveness of the company “NTAZ” defined by the fair price in relation to the reference product at the market
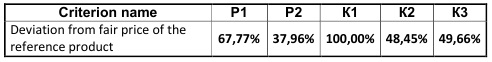
It is clear from these data that the production of “NTAZ” company is greatly inferior to its competitors on the quality characteristics. In addition, a fair price for the goods of K1 competitor is by 12% less than market rates, while the market price for the line P1 is to 2.4% above the fair price level, taking goods” qualitative characteristics! A fair price for the product P2 is at 46.32% below the market! These indicators show that the production of JSC “NTAZ” has the potential to surrender a significant market share in a short time. Sometimes there are situations where competitive analysis goes beyond the score approach and the score-weighted approach. Sometimes it happens that among the discriminated by Mark-gravimetric (scoring and weighting) method parameters appears …. a price of the commodity itself, which also depends on other factors. In this case, to do the methods of elementary analysis is virtually impossible. And here comes to the aid the regression analysis. The author of this paper, Alexander Shemetev, has developed a method for the market segmentation, when the price itself is a changeable parameter for the market segmentation that can be applicable to the market segmentation in any country. In this paper we shall consider its applicability at an example of the Russian market, and you, my dear reader, should understand that it can be applicable not just for it.
The use of regression and correlation-regression analysis for the segmentation of the Russian market Sometimes it happens that the price of a commodity in itself is a derivative component that characterizes the value of the goods. Consequently, inadequately inflated price leads at a comparable extent to a decrease in sales, to a decrease in market segment and to a decrease in the overall competitiveness of a company itself. Conversely, too low price, especially dumping, may allow the capture of extra market segments, and it may allow to increase the competitiveness of the company itself, of course, if price is a significant parameter of importance at the market. It is impossible to assess the company’s comparable competitive parameter at the market by means of a simple algebra. The general view of the definition of competitiveness at the market can be described as follows by this method:
![]() (35)
(35)
Or: ![Or: [Alexander Shemetev]](http://content.snauka.ru/web/6009_files/f36.jpg) (36)
(36)
Where: A0 - is a constant coefficient equation, which characterizes the average effect on the price of all other factors; A1 , A2 , … An - are the constant coefficients, which measure the degree of influence of parameters on the price; X1, X2, … Xn - are the quantitative values of taken into account parameters.
![]() This simple explanation by means of regressions equation is given according to the opinion of author of this paper that: it is possible to express the behavior of certain function by its expression through another functions, including the regression function, at some sufficient level.
This simple explanation by means of regressions equation is given according to the opinion of author of this paper that: it is possible to express the behavior of certain function by its expression through another functions, including the regression function, at some sufficient level.
You, my dear reader, should understand, that further in this paper I will disclose my method for you with using the developed by me formulas. The author of this paper, Alexander Shemetev, proposes the following model for the evaluation of the competitiveness of domestic companies in the market segment. This model is to be used when the price itself is a significant factor, which affects the companies” competitiveness at the market, and it also affects the companies” position within the market segment. This model, developed by the author of this paper, evaluates these parameters in modern Russian conditions. To dete RMI ne the author’s model, you, my dear reader, should be familiar with the concept of correlation. Correlation (r) – is the mathematically expressed linear relationship between two variables. It is calculated by the formula:
![To determine the author's model, you, my dear reader, should be familiar with the concept of correlation. Correlation (r) - is the mathematically expressed linear relationship between two variables. It is calculated by the formula: [Sir Francis Galton]](http://content.snauka.ru/web/6009_files/f37.jpg) (37)
(37)
It should be noted that:
![It should be noted that: [Sir Francis Galton]](http://content.snauka.ru/web/6009_files/f38.jpg) (38)
(38)
Where X and Y - is a pair of variables, the relationship between them is calculated; n - is the number of observations (the more observations – the more accurate calculation is);
X and Y – this is the average value of the observed variables of X and Y;
Cov (X, Y) - is a ratio of covariance , which shows the relationship between two variables;
![]() - this are the standard deviations, which show the total amount on which the parameters will be rejected (not to repeat the word ‘deviated”) by average measure.
- this are the standard deviations, which show the total amount on which the parameters will be rejected (not to repeat the word ‘deviated”) by average measure.
![]() Correlation ratio has a rich history. Let it be in my other publications.
Correlation ratio has a rich history. Let it be in my other publications.
These indicators measure a variety of business settings of the company and can be used for financial analysis. Let’s consider the following simple example to secure the material better on these values. So, let’s distract a bit from the main course of this paper, and let’s see this example. There is a small conditional company Co Ltd ‘daisy”, and it plans to receive some revenue in the next year: with probability 0.1 it will receive 10 000 USD; with probability 0.2 it will receive 15 000 USD; with probability 0.3 it will receive 21 000 USD; with probability 0.2 it will receive 25 000 USD; with probability 0.2 it will receive 30 000 USD. Then the expected revenue in next year will be: 0.1*10000+0.2*(15000+25000+30000)+0.3*21000 = 21300 USD This is how the calculation of the mathematical expectation looks like, the mathematical expectation of likely average yield at the market (AY(PI) – Average Yield and Probable Income):
![This is how the calculation of the mathematical expectation looks like, the mathematical expectation of likely average yield at the market (AY(PI) – Average Yield and Probable Income): [Blaise Pascal]](http://content.snauka.ru/web/6009_files/f39.jpg) (39)
(39)
Where: Bi - is the probability of the i-th income; Di - is the sum of the i-th income. An entrepreneur also assesses the risks of obtaining or shortfalls in certain share of the profits, which his or her or their company is expected to receive in a future period or periods. Since the quantitative estimations of probability are not always reliable, the actual value of some parameter may be different from its predicted value; so it may be different from what you, my dear reader, probably, expected earlier.
This is the point, where it appears the concept of business risk. This is the most subjective aspect of any project evaluation, because the risk is assessed individually by each person, as well as probabilistic assessment.
The probability of deviation of the actual value from the expected is higher, when the spread of values of a random variable is wider. So, the wider is the spread of values of a random variable, the higher the probability of deviation is. Therefore, the so called standard deviation (![]() ) is used as a measure of the risk inherent in the solution with a probabilistic outcome. The so called standard deviation (
) is used as a measure of the risk inherent in the solution with a probabilistic outcome. The so called standard deviation (![]() ) – is root-mean-square (RMS) absolute deviation of possible values of a random variable from the variable as expected. In this example, the risk for the company not to make the expected profit is:
) – is root-mean-square (RMS) absolute deviation of possible values of a random variable from the variable as expected. In this example, the risk for the company not to make the expected profit is: ![]()
Which is equal to 16 026.54 USD – this is the absolute value of the standard deviation of individual features from their overall average (21 300 USD). That means, this figure provides a corridor of the most probability of the company’s receipts distribution in the future, in our example, this corridor is distributed in the range of 13 286.73 USD to 29 313.27 USD profit in the future year. If the value of standard deviation (![]() ) is divided by the probability the most probable revenue margin, we shall obtain a coefficient of variation:
) is divided by the probability the most probable revenue margin, we shall obtain a coefficient of variation:
![If the value of standard deviation ( ) is divided by the probability the most probable revenue margin, we shall obtain a coefficient of variation: [Sir Francis Galton]](http://content.snauka.ru/web/6009_files/f40.jpg) (40)
(40)
In this example, the coefficient is equal to: ![]() .
.
The high value of the coefficient of variation shows that the variations of the receipts in the future is sufficiently large, which imposes a substantial risk of revenue deviation in the coming year from the expected values. Now, let’s get together with you, my dear reader, let us now return to the market segmentation by the method developed by the author of this paper, based on correlation and regression analysis. A few words should be said about the value of n, which characterizes the total number of observations.
The larger this quantity – the more accurate the calculation is. Mathematically it is proved proved, that the 100% coincidence of index of correlation is achieved with super-large numbers of observations: over 25.000. The observations over 100 units are large enough to make conclusions: about 99% (without extra-occasions). When the number of observations is about 25 – the rate can be calculated to an accuracy of up to 80% (without extra-occasions). However, in the case of 100 units, as like as in the case of 25 – there may be risk of actual parameters” discrepancy from the data obtained by the correlation-regression analysis.
That is why the number of observations is not the only factor which affects the accuracy of this type of analysis. There appears the concept of coverage in the number of observations. It is desirable that the coverage was over 25% of the sum of observations – then on that basis you can build a variety of hypotheses. Coverage of 50% – 70% allows us to construct sufficiently objective hypotheses; and when the coverage reaches more than 85% – 95% – it allows to output patterns.
It should be noted that the correlation coefficient is never less than -1 and is never more than +1. If the index value is 0 or close to it, there are no relationship between the indicators. If the ratio is equal or close to one, it suggests that the growth rate of both indicators is comparable: the growth of one indicator stimulates the adequate growth of another one. If its value is equal or close to -1, , it indicates that the growth rate is comparable to the decrease of another indicator: the growth of one indicator stimulates the adequate decrease of another one. For example, the correlation coefficient of +0.91 means that approximately 91% of the index A is reacted in the same trend as the 100% change in the trend of index B.
The author of this paper, Alexander Shemetev, has developed for you, my dear reader, correlation-regression model assessing the competitiveness of domestic companies in the market when the price itself is a significant factor affecting the competitiveness of companies at the market and its positioning within the market segment. It’s the mean of the model expressed in one sentence. In other words, the situation when price itself is not an important factor – it is rather a rare situation.
The strategy demands the company to dete RMI ne itself: the price leadership or positioning (differentiation) – which is fair for most part of goods and services performed at the world market today. And the consumers of the products – they usually have another model: this model estimates both price and positioning parameters (the differentiation between the commodities). In this case, the price is an important factor, which influence greatly to which part of segment a company can share.
This model is called by me a-g analysis, in accordance with the names of the basic steps for systematically calculating the coefficients a, b, c, d, e, f, g. It should be noted that the model suggests the importance of accounting parameters in percentage terms, so that their sum was equal to 100% (for example, the importance of price = 80%, and other factors = 20%, an amount is equal to 100%).
All the ratios: a, b, c, d, e, f, g - are developed by the author of this paper, Alexander Shemetev. The general mathematical form of the sum of comparable scores reflecting the company’s competitiveness in the market and the prospects for change in its position within the market segment (gi) are expressed by the following formula, developed by the author of this paper (41):
![The general mathematical form of the sum of comparable scores reflecting the company's competitiveness in the market and the prospects for change in its position within the market segment (gi) are expressed by the following formula, developed by the author of this paper (41): [Alexander Shemetev]](http://content.snauka.ru/web/6009_files/f41.jpg)
Where: Bi - is a total score of the i-th performance in relation to a product line of the company’s products; ai - this parameter, expressed as a percentage, describes the significance of each score of i-th specification for the product line of the company; Pi - is the price of the i-th product of analyzed line of business system; RFP - is expressed as a percentage: it is the significance of the indicator which assesses the market prices and properties of products at the market; PMAX (Cmax) - this is the price of the product from the company, the sum of the c coefficient for which has the maximum value; The coefficient c calculates the comparable adequacy of Prices for the analyzed segment, the algorithm for its calculation is given below; nF - is the total number of significant factors, in addition to price, which are included in the valuation model; r(BK, PK) - is the value of the correlation coefficients of significant parameters for products with the price among competitors. Let’s break the above formula to the steps A - g, expressed by the corresponding coefficients. Coefficient (a) expresses the amount of non-price factors of some company at the market, taking into account the mathematical discrimination; it is calculated as follows (by the formula, developed by the author of this paper):
![Coefficient (a) expresses the amount of non-price factors of some company at the market, taking into account the mathematical discrimination; it is calculated as follows (by the formula, developed by the author of this paper): [Alexander Shemetev]](http://content.snauka.ru/web/6009_files/f42.jpg) (42)
(42)
After the calculation of this coefficient, you, my dear reader, should perform a calculation of the coefficient b, which expresses the relationship between the market-adequate estimation of every important parameter included in the model with respect to the perception of price by consumer (b ratio methodology is also developed by the author of this paper) (43):
![After the calculation of this coefficient, you, my dear reader, should perform a calculation of the coefficient b, which expresses the relationship between the market-adequate estimation of every important parameter included in the model with respect to the perception of price by consumer (b ratio methodology is also developed by the author of this paper) (43): [Alexander Shemetev]](http://content.snauka.ru/web/6009_files/f43.jpg)
Where: F - is assessed, in relation to the perception of price changes (P), factor; only the market indicators are taking in its calculation, without the calculation of the indicators of the company under an analysis at the market; n - is the number of estimated competing products at the market; ![]() - this are the average values of the factor (F) and prices (P) among the competing products in the market segment; k - is the numerical number of significant factors evaluated in the market segment that have a direct impact on the perception of market products by the consumers of this segment;
- this are the average values of the factor (F) and prices (P) among the competing products in the market segment; k - is the numerical number of significant factors evaluated in the market segment that have a direct impact on the perception of market products by the consumers of this segment; ![]() - is the multiplication of the average deviation of the estimated factor (F) and price (P).
- is the multiplication of the average deviation of the estimated factor (F) and price (P).
The third step is to calculate the coefficient (c), which shows the average dependence per a single average score factor for a company in the market from price changes (P). It is calculated as follows for the i-th company in the market segment (by the formula, developed by the author of this paper):
![The third step is to calculate the coefficient (c), which shows the average dependence per a single average score factor for a company in the market from price changes (P). It is calculated as follows for the i-th company in the market segment (by the formula, developed by the author of this paper): [Alexander Shemetev]](http://content.snauka.ru/web/6009_files/f44.jpg) (44)
(44)
Where: ΣF - is the number of significant non-price factors, which is taken for evaluation. It is considered normal, if the coefficient (c) is obtained significantly greater than 0, while positive for most of the analyzed companies in the market at the same time. This means that the relevant to model parameters were chosen correctly.
If the coefficient (c) is obtained less than 0, it indicates the probability of two factors on the market. The first is the wrong choice of important criteria themselves that affect the consumer choice. It is possible that the consumer evaluates a product of a company in completely different parameters and indicators, for example, by choosing the parameters of price, location of shops (outlets), display of goods, color and design of products and so on. Another factor may be the actual presence of a paradox: in fact the market has developed so that the higher the price, the lower the quality of commodity is / or other parameters selected for analysis /.
Therefore, not quality indicators are important to the consumer – the consumer prefers completely different characteristics that are not included in the model. At the same time, if, for example, there were selected quality characteristics for the model which are much important for consumers, it is possible for the company to beat its competitors by bringing to market a quality product and having it presented to the consumer: for example, once upon a time in the past the relatively higher quality imported cars pushed much at the market segment the relatively inferior Soviet prototypes of cars…
Correlation, ie, linear dependence, is a characteristic of the whole price as a factor, and it is not without a good reason. Generally, it is so: the lower the price, the higher the demand, and vice versa. Sometimes there are some exceptions in the form of essential goods and luxury goods. At the same time, even those goods can also be characterized by a linear model based on the price at a large price scale: too cheap in a short period luxury goods are likely to be immediately wiped off the market as soon as the buyers know about it; at the same time, if some essential goods will significantly be increased in its price for a short period of time (that happens in Russia, for example, in the winter), it is likely a significant decline in demand for the goods, if the price of other essential commodities will not rise behind.
If the model coefficient (c) is very close or equal to zero, then it is likely to suggest that either the factors are chosen incorrectly, or the consumer pays attention at this market primarily on price rather than product characteristics. In this case, the strategy for the company in this market should be not considered in this section: most probably, it should not be differentiation – it should be cost leadership, which was discussed earlier in this paper. Further, the market selects a product that has maximal (c) value with respect to all other products of the analyzed segment. Of course, it should do you, my dear reader, as an analyst.
At the same time, the analysis is based on objective market data (it should be so), so we can say it is the market that chooses this (c) parameter maximal at some certain product inside some certain market segment. This product is taken as the standard, that is, it is believed that it has a 100% efficiency of the prevalence of significant consumer properties. Consequently, all other products on the market will have the same index less than or rarely equal to 100%. The following coefficient d aligns all commodities and products in the analyzed segment of the market under the reference of the best consumer features, combined with the price of goods. This operation is carried out by a simple transformation:
![The following coefficient d aligns all commodities and products in the analyzed segment of the market under the reference of the best consumer features, combined with the price of goods. This operation is carried out by a simple transformation: [Alexander Shemetev]](http://content.snauka.ru/web/6009_files/f45.jpg) (45)
(45)
Where: di - is matched with the standard i-th product in the market, which has a total (ci) score, which reflecting a combination of consumer-relevant features and prices of goods. C(MAX) - this is a product at the market, whose size (ci) is the maximum, ie, the reference product which like standard at price and important for consumers characteristics If you, my dear reader, subtract the indicator (di) of (1 – di), we obtain the indicator (e), which expresses the deviation of consumer-relevant properties of the product – relative to the price of that state as if the i-th product in the market would have a benchmark performance for optimal price-performance ratio :
![]() (46)
(46)
Then, on the basis of the available properties and characteristics of the product, it is calculated reference price for the i-th product (f), which optimally combines the available relevant to the consumer characteristics of goods and brings them to the point of optimal price:
![]() (47)
(47)
Where: PMAX (Cmax) - this is the price of the product from that company, which has the amount of (c) ratio at the maximum in this market segment level. The indicated price is the price of the product, which has important consumer characteristics and properties and is optimally correlated with the price, which represents the maximum value of the coefficient (c). Further, it should be calculated next: the amount of calculated price deviation of i-th product in the market segment from the reference price for the i-th product:
![]() (48)
(48)
Where: Δ - is the mathematical symbol of difference; Pi - this is the actual market price on the i-th product in the selected market segment. The next coefficient (h) is the actual deviation for the product from the standard, expressed as a percentage:
![]() (49)
(49)
The coefficient (i) virtually completes the analysis of a company’s competitiveness in the market segment, and it assesses company’s occupied segment. This indicator points to how much the average score deviates from the reference price listed:
![]() (50)
(50)
Where: RFP - is expressed as a percentage: it is the significance of the indicator which assesses the market prices and properties of products at the market; 100 - this is the figure to convert interest into points. As you, my dear reader, may remember, for the use in the author’s model, all factors of significance to be converted into the percentage in such a way that their sum to be 100%.
The resulting model’s indicator is the coefficient (g), which calculation is presented above in this paper. In terms of the above factors, figure (g) for the i-th company in the market segment will be calculated by the formula:
![]() (51)
(51)
This indicator will show a comparable competitive option in cases where price itself is a significant factor in the market segment for a product. Now, let me share with you, my dear reader, consider in a quick look in the (g) indicator interpretation.
If the index is obtained comparable with the market leaders, such companies need to pay more attention to performance indicators, the coefficient (b) for which is close to 1, at the same time, to pay minimal attention to indicators, the coefficient (b) for which tends to zero or minimal, including negative values. If the index (gi) for some companies is relatively small in comparison with the market leaders, especially if it is negative, then this line of products, most likely, is not to be positioned at the market by the differentiation strategy – it is, most likely, to be used the cost leadership strategy.
It is so, because such product loses to its competitors on the important for the consumers parameters so that it may have no sense to invest recourses to upgrade such product over the time. The strategy of cost leadership was discussed earlier in this chapter. Let me make a slight digression concerns the specificity of the above calculations. The calculations, as you know, may easily be calculated by means of modern computers and computer programs on any operating system.
So, any operating system has special programs that easily calculate the degree (^), the correlation and so on. So, you, my dear reader, may analyze these formulas in their small components with no problems at all, and find out which component causes the deviation from the more normal for this market segment parameters. Let us now consider an example for a more visual perception of the material. Let us take our known (from the above examples) conditional corporation JSC “NTAZ”.
Just now imagine that it was well established: the price for it goods is established, and price is a significant factor for consumers when buying a car. Also imagine that the JSC “NTAZ” decides to analyze 100% of the market to know better its competitors. The company has two production lines of their own, and the company found that it had only 12 lines of competitors” production in the market segment occupied by this company. All the competitors produce 12 types of products (K1 – K12).
The method of marketing research established the following product features and their importance at setting prices to keep in this segment, converted into percentages:
Table: Competitive characteristics of the lines of “NTAZ” at the market
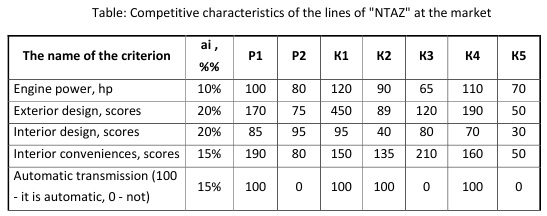
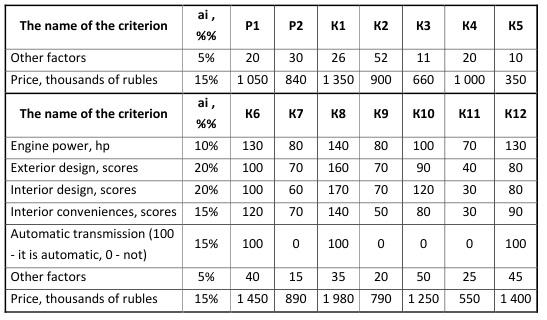
So, the price itself is a significant factor for the consumer: the higher it is – the lower the demand is, and vice versa. At the elite market, it is sometimes the case that the lower the price – the lower the demand, and vice versa. Let’s begin by calculating the coefficient (a) for the product P1 (A (P1)):
![]()
ai - is the conditional name of relative density of i-th parameter importance, in this case, of every parameter in the table. Similarly, we find significant coefficients for other goods and lines:
Table: Values of the indicator (a) at the analyzed market, scores
![Table: Values of the indicator (a) at the analyzed market, scores [Alexander Shemetev]](http://content.snauka.ru/web/6009_files/t12.jpg)
![Table: Values of the indicator (a) at the analyzed market, scores [Alexander Shemetev]](http://content.snauka.ru/web/6009_files/t13.jpg)
The table shows that: product of rival K1 is the most important for the consumer’s basic characteristics, without taking into account the significance of such factor as prices. The spread in the market segment for a significant for buyers indicators is large enough. We now turn to an analysis of the indicator (b).
For example, let’s calculate the correlation between the index of the engine power (EP) and prices for the products in the test segment (b (EP)):
![For example, let’s calculate the correlation between the index of the engine power (EP) and prices for the products in the test segment (b (EP)): [Alexander Shemetev]](http://content.snauka.ru/web/6009_files/e18.jpg)
For brevity, some indicators have been taken in thousands of rubles (t.r.), or billions of rubles (blns.), knowing that the proportion of more precise values of these indicators were taken into account in the calculations. As it is evident from these calculations, one of the most important consumer properties of goods, affecting the price, is the power of the engine – it leads directly to an equivalent increase in the price of a product, which is adequately perceived by the buyer. The remaining coefficients b, as well as the rate Σb / ΣF (average index in the table below) is be calculated similarly and the results of calculations are presented below:
Table: Values of indicator (b) in the analyzed market segment
![Table: Values of indicator (b) in the analyzed market segment [Alexander Shemetev]](http://content.snauka.ru/web/6009_files/t14.jpg)
As you, my dear reader, remember, the ΣF in this model means the number of factors that are included in the model. Nevertheless, if you even did not recall it, it would be the only probable figure to be mathematically adequately added in the sum of factors – the number of these factors.
From this table it is clear that, despite the fact that the interior comfort and exterior styling of a car is a significant factor for the consumer, however, they are not regarded as adequate factors by the market to increase the price! Most probably, the client believes that these two factors do not have to carry the basis for adequate price increases, relative to the increase in the other above mentioned factors. Thus, there is a situation in the analyzed segment for a while. Specified above analysis is the basis of adequate scoring in order to bring non-price performance relative to a comparable value, which would include all the important factors in the market segment, including price. Let’s define the coefficient (c):
![Specified above analysis is the basis of adequate scoring in order to bring non-price performance relative to a comparable value, which would include all the important factors in the market segment, including price. Let’s define the coefficient (c): [Alexander Shemetev]](http://content.snauka.ru/web/6009_files/e19.jpg)
Similarly, we can calculate the coefficient (c) for other products at the market:
Table: Values of coefficient (c) in the analyzed market segment, scores
![Table: Values of coefficient (c) in the analyzed market segment, scores [Alexander Shemetev]](http://content.snauka.ru/web/6009_files/t15.jpg)
The table shows that the maximum (c) rate becomes a product K1, which should be taken as a reference in relation to the significant parameters, which are optimally perceived by the market toward such parameter as price. Since the calculation of other indicators are based on the relatively simple formulas, the calculations of the coefficients d, e, f, Δf, h, i, g – will be given in the table below:
Table: Values of (d – g) in the analyzed market score.
![Table: Values of (d - g) in the analyzed market score [Alexander Shemetev]](http://content.snauka.ru/web/6009_files/t16.jpg)
![]() So, for example, for the P1 production line the ratio d=166,72/252,53=66,02%; the ratio е=1-66,02%=33,98%; the ratio f=1350000rub.*(1-33,98%)=891270rub. /1350000r. is the reference product price at this market segment, which is known by ratio (c)/; the ratio ∆f=1050000rub. – 891270rub.=158730rub.; the ratio h = 158730rub. / 1050000rub. = 15,12%; the ratio i=15,12%*(1+15%)*100=17,38 /(1+15%) – is, as you, my dear reader, remember, the increase to the common meaning of the consumer’s importance of price/; the ratio g=105,5-17,38=88,12.
So, for example, for the P1 production line the ratio d=166,72/252,53=66,02%; the ratio е=1-66,02%=33,98%; the ratio f=1350000rub.*(1-33,98%)=891270rub. /1350000r. is the reference product price at this market segment, which is known by ratio (c)/; the ratio ∆f=1050000rub. – 891270rub.=158730rub.; the ratio h = 158730rub. / 1050000rub. = 15,12%; the ratio i=15,12%*(1+15%)*100=17,38 /(1+15%) – is, as you, my dear reader, remember, the increase to the common meaning of the consumer’s importance of price/; the ratio g=105,5-17,38=88,12.
![]() All the same coefficients are calculated in the same way for the other products performed at this market segment.
All the same coefficients are calculated in the same way for the other products performed at this market segment.
![]() All the indicators in this table are represented in per-cents (%) /d,e,h/, scores /i,g/ or rubles /f,∆f/.
All the indicators in this table are represented in per-cents (%) /d,e,h/, scores /i,g/ or rubles /f,∆f/.
The above table shows that the products P2, K2, K5, K6, K7, K9, K10, K11, K12 need to change the strategy of positioning products from significant differentiation of properties. These products lose on the perceived by consumer price relative to the meaningful to the consumer characteristics.
It would be better for such products to be positioned on similar market segment by adopting the cost-leadership strategy, possibly, by including the elimination process of some differential properties of the product or parts thereof (within their reasonable values), which are not much needed to consumer who seeks the best-price-product (BPP).
Also, these companies need to increase the turnover speed, which should be the result of switching to a different strategy of positioning products at the market.
The main competitors in the market are products: P1, K1, K3, K4 and partly K8. In this competitive fight the K1 company has the best chances in expanding market segment due to gradual displacement of competitors by means of its products” importance for consumers. This company was best able to combine the relevant parameters for the consumer at the right price.
When using this technique and the choice of the reference product, it should also be parallel to a further analysis to dete RMI ne whether the production standard of the company (in this case, of K1) is in high demand in the market segment. There can be a situation, when the same price for the products among such-like companies is unduly exaggerated.
This information can be found only on the basis of the analysis of the actual situation on the market. If the company production actually has a constant low demand due to high prices and lack of options, it may mean that the significance and the exact values of the consumer properties taken for the study were initially calculated incorrectly, which, of course, will also affect the final result of calculation. In the development of competition in the market, which suggests the presence of many competitors in each market segment, the percentage of error in the calculations for the correct dete RMI nation of the significance of the parameters will tend to a minimum. Let’s now consider the arachnoid-segmentary diagram perfo RMI ng the findings of the analysis: Segmental Arachnoid diagram :
Competitiveness in the market segment by Alexander Shemetev’s regression analysis (a-g)
![Segmental arachnoid diagram: Competitiveness in the market segment by Alexander Shemetev’s regression analysis (a-g) [Alexander Shemetev]](http://content.snauka.ru/web/6009_files/s7.jpg)
![]() My dear reader, please, note: the Arachnoid diagram is built so, that the “,” sign means fraction (for instance, 0,1 here – is 10%).
My dear reader, please, note: the Arachnoid diagram is built so, that the “,” sign means fraction (for instance, 0,1 here – is 10%).
The above diagram shows the differential competitive position of companies in the market. The strategy of differentiation is impossible for most companies – they should switch to a strategy of cost leadership: so as not to leave the market completely. The same applies to the second line of production of JSC “NTAZ”, P2. Line P1 is in the top four competitors in the segment, which is a positive trend.
Also, a number of additional market analysis should be done for a more complete dete RMI nation of the market position for the “NTAZ” company The method of regression analysis is the most expensive in application to a life for a particular company – it is usually much more expensive than score-weight method. The score and score-weight methods are cheaper, that is why these both methods can be applied by all the companies in each market segment.
There are some ways to make the regression analysis method cheaper, for instance, in case when the relevant parameters and their properties are set in the mostly expert opinions, without expensive market research. In this case, the competitive analysis of companies is reduced to a competitive analysis of their products on the market. Absence of market research can lead to biased data towards the interconnections of companies and their goods competitiveness. All three of these approaches: scoring, score-weighting and the regression analysis – they are the methods of assessing a company’s competitiveness in the market segment at the expense of assessing the competitiveness of their product lines and their market relevance. An alternative, or rather, an addition to the above approaches of the analysis is substantially more expensive approach based on cluster analysis of the market. Now, let’s move on to supplement of the above analysis …. to the multi-segmentary models in terms of Russian reality. Alexander Shemetev’s method: Multi-segmentary models application to estimate the competitiveness of Russian companies at the market If the previous, factorial approach used to evaluate the company’s competitiveness mainly by internal components of the company and its products, the approach developed by the author of the multi-segmentary analysis is designed to assess the situation on the Russian market in the segment occupied by a company as a whole. The analysis consists of two models: multi-segmentary analysis of consumers and multi-segmentary analysis of market, which are considered below.
Alexander Shemetev’s method: Multi-segmentary analysis of the Russian market
The author of this paper offers you, my dear reader, the next technique. This technique is developed by Alexander Shemetev, who is the author of this paper. This model estimates conditional ideal company at the market. The author of this paper analyzed all 100% of Russian companies (including small) for the period from 2009 to 2010 (the end of 2010 is taken analytically). The 100% of companies from the next industries were analyzed: A/C , FEC-1, FEC-2 , RMI , FTAP , TEX, WWP , PPPPP,MET, Auto, CON, WST, RetT, HOSP, RE, EDU, SER. Explanation of these symbols is given at the beginning of this paper. There, we saw 100% sample of companies from these industries according to data of the Federal Tax Service on the tax base amounts (operating income). The indicators given here are based on data from Goscomstat (the Governmental State Committee of Statistics in Russia) for the abovementioned periods. All companies can be divided into large and small. Because of this, the multi-segmentary analysis will be based on data from large and small companies in each of these industries. The author of this paper has made an emphasis on the analysis of passives of companies which function in a certain industry, realizing that they perform the structure of price of companies” functioning at the market. The asset structure was calculated by the author of this paper based upon linear approximation of the industry (except for the performance of receivables).
![The author of this paper has made an emphasis on the analysis of passives of companies which function in a certain industry, realizing that they perform the structure of price of companies’ functioning at the market. The asset structure was calculated by the author of this paper based upon linear approximation of the industry (except for the performance of receivables). [Alexander Shemetev]](http://content.snauka.ru/web/6009_files/t17.jpg)
![The author of this paper has made an emphasis on the analysis of passives of companies which function in a certain industry, realizing that they perform the structure of price of companies’ functioning at the market. The asset structure was calculated by the author of this paper based upon linear approximation of the industry (except for the performance of receivables). [Alexander Shemetev]](http://content.snauka.ru/web/6009_files/t18.jpg)
![]() The abbreviations inside the matrix system: Passives – this is the sum of passives equal to the total sum of liabilities (TL) plus the sum of owned capital (equity) ( OC(Eq) ); TL - is the sum short-term liabilities (STL) plus long-term liabilities (LTL); AP – accounts payable; AR - accounts receivable; Assets – the sum of assets, equal to the sum of mobile or current assets (MobA) plus the sum of immobile (non-current) assets ( ImmA ); Rev - the sum of company’s revenue; COSTS - the total sum of costs; GM – gross margin; PBT - profit before taxes; NP – Net Profit; Inv – Inventories; MF+STFI – monetary funds plus the sum of short-term financial investments; PA – Profitability of assets; P sales – Profitability of sales.
The abbreviations inside the matrix system: Passives – this is the sum of passives equal to the total sum of liabilities (TL) plus the sum of owned capital (equity) ( OC(Eq) ); TL - is the sum short-term liabilities (STL) plus long-term liabilities (LTL); AP – accounts payable; AR - accounts receivable; Assets – the sum of assets, equal to the sum of mobile or current assets (MobA) plus the sum of immobile (non-current) assets ( ImmA ); Rev - the sum of company’s revenue; COSTS - the total sum of costs; GM – gross margin; PBT - profit before taxes; NP – Net Profit; Inv – Inventories; MF+STFI – monetary funds plus the sum of short-term financial investments; PA – Profitability of assets; P sales – Profitability of sales.
![]() The above matrix performs the characteristics of an average company structure at a certain industry.
The above matrix performs the characteristics of an average company structure at a certain industry.
![]() The sign “,” in the tables above means fraction sign; for example, 0,1 means 10%.
The sign “,” in the tables above means fraction sign; for example, 0,1 means 10%.
Let us briefly analyze the average company in the market. The above integrated matrix system integrates in itself the data of all the companies that are included in this industry, except for micro-enterprises. These are average data analysis of 100% of the industry for 2009 – 2010, calculated on an average company. The following is a Histogram of the average book value of companies in the industry in thousands of rubles; Histogram: The book value of an average company in an industry, thousand rubles
![Histogram: The book value of an average company in an industry, thousand rubles [Alexander Shemetev]](http://content.snauka.ru/web/6009_files/h1.jpg)
The Histogram shows that the largest companies are concentrated in the petroleum industry of Russia.
The average company in the oil industry is bigger in more than 71 times, in the average, than any company from all other branches in total. This imbalance, of course, imposes a significant impact on the domestic market companies. In Russia there are only about 5 million companies / 4.906,4 thousand / according to the 3rd quarter of 2010, except for micro-companies.
Slightly more than 4,077 thousands of companies (83.2% of the total number of companies in the Russian Federation) operate in the analyzed in this paper’s industries, the companies which are also the basis for the provided here marketing analysis, made by the author of this paper.
Strong imbalance causes the oil sector. Such a high proportion of the average company in the oil sector is caused by that fact that there only 12,900 companies, representing less than 0.25% of the total amount of companies under an analysis. Also, there are relatively few business systems in the RMI (10.200),MET (38.200) and Auto (3,600) sectors. Other relevant data on an overall analysis of the domestic companies are represented further. The following bar chart describes the average amount of annual revenue of the industry:
Histogram: The volume of the average company’s revenue by industry, thousand rubles
![Histogram: The volume of the average company’s revenue by industry, thousand rubles [Alexander Shemetev]](http://content.snauka.ru/web/6009_files/h2.jpg)
The greatest economic activity is performed in the oil sector.
The average company in this industry gives ten times more revenue than other sectors” companies. High rates of economic activity do not provide the prosperity of companies in the sectors of the economy. The economic crisis of late 2008, and continuing throughout 2009 and 2010, made significant changes in the bifurcation shifts of certain sectors of the economy as a whole, while strengthening the position of some other industries:
Multi-sectoral diagram of bifurcation shifts in the branches of Russian economy
![Multi-sectoral diagram of bifurcation shifts in the branches of Russian economy [Alexander Shemetev]](http://content.snauka.ru/web/6009_files/h3.jpg)
This multi-sectoral diagram shows the dynamics of the total tax base (operating profit or profit before taxes (PBT)) in the economy among 100% of domestic companies in the period from early 2003 to early 2010, with taking into an account all the 100% of the taxable income of the analyzed sectors. Bifurcation shift significantly crippled such sectors as: TEX, WWP , Auto, which lost more than half of its financial performance. Partially, there were affected theMET, FTAP and some other industries.
The entire energy sector (FEC), EDU, WST and RetT are able to significantly strengthen their positions in the economy at the peak of instability. The A/C branch was able to keep its pre-crisis position up till the middle of the hot summer of 2010 (it wasn’t primary much affected by the crisis – it was effected by the force-majeure factors from June 2010 till July 2011 /the end of export embargoes/).
Qualitative indicator of the companies in the market is the return on assets (or the profitability of assets). The followingHistogram shows the data on the average profitability of the business-systems that function in the analyzed fields:
Histogram: average return on assets of the company by industry, %
![Histogram: average return on assets of the company by industry, % [Alexander Shemetev]](http://content.snauka.ru/web/6009_files/h4.jpg)
Note: The sign “,” means fraction sign (for instance, 0,1 is 10%).
The qualitative indicator of companies” functioning effectiveness aligns more strongly the data on the average performance of each company in Russia. As expected, the maximum return gives the oil sector, and the maximum loss – gives the sectors of Auto and WWP , which are most heavily affected by the influence of the bifurcation changes in the economy.
At the same time, the average company in TEX industry is marginally profitable, and not a loss. The crisis of this industry is associated with high competition from foreign producers of textiles, especially with Chinese products. The highly profitable sectors include RMI , FTAP ,MET, WST , EDU.
These industries are able to produce revenue of about 5% of book value per year, without regard to the specific method used in the company’s management accounting. Companies of other industries can be attributed to the average cost-effectiveness. Please note that the data shows that the A/C company gives a substantially higher profitability in the integration with the industrial complex, when the both sectors begin to enter in the highly profitable sector in Russia: FTAP (profitability of companies of AIC /Agro-Industrial Complex/ is more than 5% per year). This value is the net profitability of company in this industry in the taxable base (PBT - profit before taxes).
The data is based on analysis of all the 100% of companies from all these industries in the period 2009-2010, with subsequent stressing to the average firm in these segments of the national economy. The volume of taxable income is directly linked to the level of payback period of investment in the company. The actual value of the named measure is plotted in the Histogram below:
Histogram: The average payback period of investment to company by industry, years
![Histogram: The average payback period of investment to company by industry, years [Alexander Shemetev]](http://content.snauka.ru/web/6009_files/h5.jpg)
Note: The term of repayment of TEX sector is 250 years!
The remaining data are presented exactly as they are in years.
Payback period of investment to the company has been calculated without regard to: the cost of capital (both equity and debt capital), the rules of depreciation of money over the time, the value of market risk and other factors. The indicator is calculated as the ratio of total book value to the amount of profit before taxes, which shows the qualitative characteristics of the pure activity of the companies in the industry. Values were calculated by the author of this paper, based on analysis of 100% of the companies of the mentioned industries for the period from 2009 to 2010. Most quickly industries to return the investments in Russia are FEC-1 and FEC-2 .
Okay payback period is found in the companies of the next sectors: FTAP ,MET, WST , EDU, RMI . The average payback period of investment in the AIC is 18 years, while the A/C industry companies in pure have this term in 32 years. Along with the profitable industries, there are also the unprofitable industries. In particular, the strong loses brings the Auto sector companies: the average company in this sector brings over 9 years the loss comparable to the sum of investments in it, which makes it like a “black hole” for investments. As it is described earlier by the author, the Auto sector was profitable in 2007.
Prior to that its payback period was comparable to the current state of the TEX sector, then, after 2007, it became dramatically unprofitable. Companies in this segment of the market are in need of public support. Also, almost all the companies of the WWPsector became in crisis. These and such like companies should apply not the differentiation, but a survival strategy by using the entire arsenal of marketing of insolvent company. The segmentation of such companies will be discussed later in this paper a bit later. An important indicator of segmentation in the market is a form of property a certain company belongs distributed at the industries at the Russian market. This data is shown in the diagrams below:
Chart: Ownership of Companies in Russia
![Chart: Ownership of Companies in Russia [Alexander Shemetev]](http://content.snauka.ru/web/6009_files/h6.jpg)
Notes to the chart:
![]() State – companies under the 100% state property;
State – companies under the 100% state property;
![]() Priv - companies under 100% private property, they are also 100% domestic (Russian);
Priv - companies under 100% private property, they are also 100% domestic (Russian);
![]() MDSP - domestic companies under property mixed between private and state;
MDSP - domestic companies under property mixed between private and state;
![]() MDF - companies with mixed domestic and foreign capital, including 100% foreign capital companies.
MDF - companies with mixed domestic and foreign capital, including 100% foreign capital companies.
The diagram was drawn in % of all the companies: which company belongs to which property of 100% of the total amount of companies in Russia. The analysis was made by the author of this paper on basis of analysis of all the 100% of companies in each of the mentioned industries.
It is evident that the companies in each sector of the economy have their own specifics regarding ownership. The majority of registered companies in Russia are different kinds of private property. Strong state presence remains in the sectors: EDU,SER,MET, PPPPP, WWP , FTAP .
Arachnoid diagram : the concentration of competition in the Russian market by sector (by number of companies in each industry, pcs.)
![Arachnoid diagram: the concentration of competition in the Russian market by sector (by number of companies in each industry, pcs.) [Alexander Shemetev]](http://content.snauka.ru/web/6009_files/h7.jpg)
It is clear from this diagram that the concentration of competition in the Russian market was calculated based on the total number of companies that operate in each sector of economy. The author does not take into account micro-enterprises, because they usually do not carry the burden of competition for the macro-sectors of economy. All of the above mentioned and further mentioned graphics data, Histogram s, charts, matrix systems, and other data presented in this chapter were gathered together and calculated by the author of this paper.
This information is based on the material collected by the author of this paper for 100% of the companies analyzed in each industry-sector of economic for the period from 2000 to 2010, from a mathematical discrimination of period 2009 and 2010: an analysis in this period took higher priority than analysis for other years. Along with quantitative data on the macro-segmentation of the market, the author of this paper, Alexander Shemetev, has calculated and key quality measures.
![Along with quantitative data on the macro-segmentation of the market, the author of this paper, Alexander Shemetev, has calculated and key quality measures. [Alexander Shemetev]](http://content.snauka.ru/web/6009_files/t19.jpg)
The matrix system is designed for an average company in each industry.
Initial data for calculation were taken in thousands of rubles. The sample is made of 100% of the companies of each sector for the period 2009 – 2010, except for micro-enterprises and foreign enterprises. Notations are as follows in the above integral matrix. PBT - profit before taxes; A - assets; Rev - revenue; OC(Eq) - owned capital (equity); TL - total liabilities; S TL - short-term liabilities; AR - account receivable; AP – account payable; T – term of turnover (in days per year in average) /for instance, T A -this is during how many days an average company in an industry makes 1 turnover of its assets – the figure, for instance, 663 means the company needs about 2 years to make 1 cycle of assets” turnover/; COSTS - it means costs; NWC - net working capital; OMA – company’s owned mobile assets, which is the difference between the OC(Eq) and immobile assets ( ImmA ); MatMobA - material mobile assets – these are sum of inventories plus AR minus AP; ln – natural logarithm; 2f Al – 2-factor Altman’s model for the average in an industry company bankruptcy probability; FS type – financial stability type – it can be of four basic types: A (good), B (okay), C (doubtful), D (unsatisfactory) - where type A is the best and type D is the worst type of FS; M - means model for average in an industry company’s bankruptcy probability; GSSC – the surnames of authors of the American model for bankruptcy probability which takes options (a kind of derivative) into an account [link 1]; Q – the Quebec model for bankruptcy probability; OG - Ohlson model developed by Harvard University; BT TBP – total bankruptcy probability of a company inside an industry according to the cumulative result of the top bankruptcy prognosis methods. ![]() Link 1. My dear reader, please, note that I mentioned GSSC model in this paper. This is the model of Brian N. Gibson with taking into account the researches of Stickney, Schroeder and Clark, which will be more profoundly described in my future book in English and that is yet described in my book in Russian. A1 - the industry average ratio of operating profit to total assets
Link 1. My dear reader, please, note that I mentioned GSSC model in this paper. This is the model of Brian N. Gibson with taking into account the researches of Stickney, Schroeder and Clark, which will be more profoundly described in my future book in English and that is yet described in my book in Russian. A1 - the industry average ratio of operating profit to total assets
The most profitable companies in the industry can be found in production and refining of natural energy resources, and that is of little surprise. Their profitability is by 11% – 12%, it is the leading average indicator in Russia.
All sectors, except for the WWP and the automotive industry (Auto) have a positive return on investment. High returns on assets, in average, have the food industry, mining, metallurgy, wholesale trade and education enterprises. High profitability of Russia’s economy is largely composed, and it depends on oil prices and the world-market demand for fossil fuels. The industry raises the welfare of state, and, therefore, of its citizens. The rising standard of living is increasing the demand for food and education, which stimulates the related industries. However, this does not mean the existence of such a high demand for A/C in its pure form – only for processed. It is because of the fact that agribusiness company (AIC), on average, has a margin of 2 – 3 times higher than the company just of agriculture. Average companies of AIC sector, which supply the wholesale lots of goods to market, have of 2 times higher profitability than the average companies of just agriculture sector (A/C ).
Return on assets – is an important indicator of investment attractiveness of the industry. Because of this fact, the more and more investors are willing to place their capital in promising industries. However, the sectors related to fossil fuels – are subject to changes in world prices for its main products. That is why such companies need to diversify their activities in those sectors which have an inverse correlation to the trends of development of fuel and energy companies in the economic instability conditions; and, simultaneously, preferably, those sectors for diversification would have a positive correlation with development of economy in emerging market and economic recovery conditions. The holding companies may become the companies to diversify the petroleum companies” activity: the holdings associated with food (a large chain from agricultural production to the final consumers), also the market of education may become a good sector to diversify the activity of the above mentioned companies. There is a third alternative – the extraction of minerals (other than fossil fuels) and metallurgy.
These companies have a much lower return than the fuel-and-energy complex, and such companies have a lower return than the food chains and education sectors, and, nevertheless, they are able to generate substantial revenues. Other companies are in a stage of stagnation, due to their low profitability. Moreover, some companies” profitability is negative at all. Woodworking and the automotive industry – they, in fact, have a negative return. Falling demand for timber and domestic cars exacerbates the situation. Automotive crisis is global. In a crisis, leading developed countries prefer to make products from wood substitutes, which reduces the demand for timber. In the other hand, domestic consumers, during the crisis, reduced the budget for the purchase of wood products, mainly furniture, which also caused damage to the WWP industry.
The success of these industries depends on the diversification into new markets, and not only of their own products. These companies need to obtain a control over the organizations, which give permanent cash and have a positive return, otherwise most of the companies of these industries can be restructured in various ways. The overall picture of the profitability of assets in 2009/2010 in the sectors of the economy is as follows.
Histogram: Return on assets of companies by sector
![Histogram: Return on assets of companies by sector [Alexander Shemetev]](http://content.snauka.ru/web/6009_files/a1.jpg)
A2 - the industry average proportion of operating profit and revenue.
The most profitable companies in sales are average companies in industries associated with fossil fuel (15% – 20%). Metallurgy has a sales margin of about 10%, and services related to real estate – about 8%. All other industries have sales margin no more than 6%.
The most profitable companies on sales in other industries are agriculture, agribusiness, nutrition, PPPPP, wholesale trade, and services. Their return on sales varies from 4.5% to 6%. Return on sales by industry largely correlates with the pattern of returns on assets.
All companies of all sectors must always aim at reducing production costs, while clearly focusing its strategy: if it is cost leadership – then do it by all means, if the leadership of differentiation, then the amount of cost reduction should be aimed at improving essential for the user settings, or the company risks losing its competitive position over its competitors, especially foreign ones, which are actively involved in Russian domestic markets. The most important thing is to direct resources to product development – it is important to remember for the companies whose motto is leadership of the parameter or parameters.
Otherwise, such company can stay in the leadership strategy of differentiation, having the products that are suitable only for the strategy of cost leadership, and having its product at an inflated price …
The only thing to which companies it does not relate directly – these are companies that produce highly specialized products. For these companies there persists a little competition, and, because of that, they can afford to use both strategies at once: to reduce costs and to get ahead in the parameters, obtaining a profit in the long term with minimal risk. Specialized branches are few, and they do not fall under the description given by the author at the matrix, unless their products are not directly associated with these macro-sectors, which may make such firms as not highly specialized business-systems ….
Return on sales of companies by sector in 2009/2010 in the economy represented at the following scheme:
Histogram: Return on sales of companies by sector
![Histogram: Return on sales of companies by sector [Alexander Shemetev]](http://content.snauka.ru/web/6009_files/a2.jpg)
A3 - the industry average proportion of operating profit and owned capital (equity)
The greatest return on equity have companies associated with fossil fuel and mining of different non-fossil-fuel-minerals and metallurgical complex. Return on equity in these industries is ranged from 9.3% to 26.56%. There are also some highly profitable companies in other sectors: in the industry PPPPP, wholesale trade, retail trade, real estate and education. Averages of other industries are medium profitable. Negative returns on all indicators have automotive, woodworking and wood processing sector (WWP ). For example, return on equity in an automotive complex is (-35.88%)! The foregoing speaks of crisis in the industry. Let’s look at the chart of return on equity for the industry-average companies in the industry.
Histogram: Return on owned (equity) capital of industry-average company in 2009/2010, %
![Histogram: Return on owned (equity) capital of industry-average company in 2009/2010, % [Alexander Shemetev]](http://content.snauka.ru/web/6009_files/a3.jpg)
It is evident that the Russian economy is developing unevenly. Some industries are developing rapidly and some – slowly. All this calls either for diversified investment chains creation in the economy, or for the hard state control over the cost of borrowings for industrial consumers – companies of these industries, as well as control over the tax regime and government incentives. I think, we should stop a bit more in details at the diversified investment chains in the economy. Of course, these are large cross-industry holdings within the same chain. The domestic economy, for example, has chains of food, education, and more. For example, the industry average profitability of the diversified investment chain of food supply is divided unevenly.
The primary producer, A/C , has the lowest return of OC(Eq) in 7.2%. At the same time, the AIC has already 14% efficiency at the same parameter. The food supply industry has the same figure – about 20%; wholesale and retail trade of food has the average efficiency around 15%. It is evident that there may be more rigorous study of the integration of the companies from specified industries by large holdings, which would support the production and sale of their entire diversified investment chains.
The author of this paper believes that his term: the diversified investment chain – more fully describes the position of each sphere at the market’s macro-segment. For example, the A/C cannot be considered separately from the consumer of the agricultural production: food segments, retail and wholesale trade, hospitality sphere and tourism (HOSP) and other sectors: – the development of these industries is interconnected and interdependent. Only some industries work directly with the individual persons, and, as a rule, not only with them. That is why the author of this paper believes, that there should be considered the diversified investment chains in the economy.
A4 - industry average ratio of operating income to debt capital
Return on borrowed capital is maximal in industries associated with fossil fuels, and wholesale trade (24% – 32%). Industries such as mining (other than fossil fuels), food, agriculture, PPPPP, metallurgical industry, socio-cultural service and tourism (HOSP), real estate, education and services – they have an average return on borrowed capital from 12% to 20%. Let’s look at aHistogram of return on debt capital (BC) of an average company in the industry in 2009/2010,%.
Histogram: Return on debt capital of an average company in the industry in 2009/2010, %
![Histogram: Return on debt capital of an average company in the industry in 2009/2010, % [Alexander Shemetev]](http://content.snauka.ru/web/6009_files/a4.jpg)
Return on debt is related to financial stability and the risk of bankruptcy.
That is why: the higher each column in the Histogram is, the more stable is the average company, and vice versa. Financial sustainability of the industry average company ranges unevenly from industry to industry. There can be divided 5 groups of companies in the degree of financial stability, depending on the profitability of debt:
1 – Efficiency is above 20% (FEC 1 and 2, WST );
2 – Return is over 10% and less than 20% ( RMI , FTAP , agribusiness (AIC),MET , HOSP, EDU);
3 – Return is from 5% to 10% (A/C , PPPPP, RetT, RE);
4 – A positive return, which is less than 5% (TEX, CON);
5 – Negative profitability (WWP and Auto).
4 and 5 groups need the anti-crisis management – in all its ways to increase the stability of the company. Perhaps, it can be efficient the use of such strategies as: diversification, restructuring, conservation of production, identifying and selling illiquid assets, and so on. Group 3, in general, “is at zero,” because the depreciation of money in the economy absorbs a significant part of the profits of these companies.
These companies develop appropriate marketing cycle intensively, using, perhaps, aggressive marketing strategy.
1 and 2 are the groups, which are generally resistant to the crisis changes in the external and internal environment, compare to business systems listed in other groups.
Companies of this group should strenuously apply such strategies as: concentrated growth, integrated growth, diversified growth (direct, indirect, conglomerate diversification) – depending on the situation in the market.
A5 - the industry average ratio of operating profit to short-term debt
The profitability of the STL comes up to 100% within the companies associated with fossil fuel and mining. The profitability of the STL comes more than 50% within the companies associated with metallurgy and close to it industries. The WST comes closer to the metallurgy at the above mentioned indicator of efficiency. The author of this paper, Alexander Shemetev, made a complex correlation-regression analysis of companies of all branches of Russian economy, and I concluded that the development of national economy is linked together among its segments with a correlation of 70%.
This means that the development of a single segment cannot occur without the development of the economy and all its sectors at the same time! The author gave the definition of diversification investment chains in the economy. The data analysis conducted by the author of this paper suggests that the development of any industry is impossible without either the development of the entire national economy within its macro-segments, or without the development of diversification investment chains in the economy.
Let’s look at a Histogram of the profitability of short-term debt of the average company in an industry:
Histogram: Cost-effectiveness of short-term debt of the average company in an industry in 2009/2010, %
![Histogram: Cost-effectiveness of short-term debt of the average company in an industry in 2009/2010, % [Alexander Shemetev]](http://content.snauka.ru/web/6009_files/a5.jpg)
A pattern is clearly visible from the Histogram , which occurred in various sectors of national economy. Industries develop unevenly. The disproportion of the segments of the national economy indicates a situation of economic instability, in which all the efforts of companies should focus on risk management in the first place! All decisions of the anti-crisis, marketing, investment and others – should have worked through the prism of a comprehensive risk management! Some methods of risk management are discussed in my my book, devoted to the financial analysis: portfolio diversification, the action in accordance with the analysis of general market risk (the theory of William Sharpe); arbitrage pricing theory; VaR-analysis and other types of analysis.
Soon this book will be interpreted by me in English. These approaches can and should be applied in the context of economic instability, to increase their financial stability of domestic companies.
A6 - it’s the industry average ratio of accounts receivable and accounts payable
On average, accounts payable exceed accounts receivable within companies in such sectors as: agriculture (13%), textiles (10%),WWP , Construction and Auto (24% – 30%), RE and HOSP (15%), education and retail trade (53%).
In other companies receivables exceed payables by 10% – 15% (except for fuel and energy sector: FEC-1 and FEC-2 , in which this ratio can reach up to 85%). Let’s look at a Histogram of the ratio of receivables and payables average companies in the industry:
Histogram: Ratio of accounts receivable and accounts payable of average companies by industries, 2009/2010, %
![Histogram: Ratio of accounts receivable and accounts payable of average companies by industries, 2009/2010, % [Alexander Shemetev]](http://content.snauka.ru/web/6009_files/a6.jpg)
Value of accounts receivable and accounts payable shows the effectiveness of the credit process in company – that is, – the management process for the optimal levels of debts at an enterprise.
If accounts receivable is more (the column on the Histogram of more than 100%), this usually indicates an effectively streamlined loan process in the company. In general, the loan process is successful in all sectors of national economy, with the exception of the retail sector. It should be noted that: for the business-systems in education sphere the excess of accounts payable on the receivables is normal because of the industry specifics.
A7 - is the industry average ratio of debt and equity
The borrowed capital exceeds the owned one within the companies of such industries as: FEC-2 , RMI , FTAP , TEX, WWP ,PPPPP, Auto, CON, RetT. The most crisis-full in this indicator are the branches of WWP and Auto, in which the industry average debt capital exceeds its own in 2 – 3 times.
Reverse index to A7 shows the extent to financial stability: the share of equity to the loan.
The WWP industry has this figure at a point of 36.78%, or for each USD of owned capital such company has 3 USD of borrowed capital. The Auto industry companies have this rate at about 44.80%: this proportion is minimal among other segments of the economy. The borrowed capital in Russia is far more expensive than in the most developed countries – it is even much more expensive than the owned capital.
That is why the financial leverage can work in Russia far not always. It is more expensive, so the company is easy to get a high loan to cover its financial needs, at the same time, the high cost makes it more difficult for company in Russia to return money back later to the loan-capital-givers.
For instance, it is considered normal in Russia, when the borrowed capital cost is at the rate 70% a year in Russia (the effective rate, which includes all the additional commissions, extra-payments and so on). And, as you, my dear reader, may easily consider: it is not easy to invent a business that would have the profitability rate comparable with the rate to the borrowed capital, which makes thousands of Russian companies out of business every year. Also, there are some companies that make their business primary based on loan capital: FTAP (65.93%); FEC-2 (88.89%); PPPPP (94.10%); CON (57.80%); RetT (42.37%).
The maximum stability at the share of owned capital is in FEC-1 (175.40%); EDU (177.78%) and SER (299.86% – that is each 1 USD of borrowed capital has 3 USD of owned one). Let’s look at the Histogram of the ratio of debt to equity capital in average company in an industry in 2009/2010, %:
Histogram: Ratio of debt and equity in industry average company of 2009/2010, %
![Histogram: Ratio of debt and equity in industry average company of 2009/2010, % [Alexander Shemetev]](http://content.snauka.ru/web/6009_files/a7.jpg)
A8 - it’s the industry average ratio of debt to total assets
If we compare the amount of debt relative to total assets (TD/TA), than the picture will be next. The business-activity of next sectors is based on borrowed capital less of all: FEC-1; RMI ; MET; wholesale trade (WST ); HOSP; real estate (RE); education (EDU); and, in particular, in services (SER).
Histogram: Ratio of total debt to total assets of the industry average company in 2009/2010, %
![Histogram: Ratio of total debt to total assets of the industry average company in 2009/2010, % [Alexander Shemetev]](http://content.snauka.ru/web/6009_files/a8.jpg)
A9 - it’s the industry average ratio of equity capital to total assets
The index is inverse to the A8 . It shows a picture of the industry like in mirror compared to the A8 indicator. The book value of services is at 75% tied to equity, making the industry sustainable and less dependent on all the creditors. The same indicator forFEC-1 and EDU will be around 65%.
The A/C industry has this figure of no more than 43%. At the same time, the average volume of retail trade company hardly rises above 29% in average company’s book value. The crisis WWP (26.9%) and Auto (30.9%), along with negative earnings, there is a high dependence on creditors; as a consequence, the threat of bankruptcy increases.
Histogram: Ratio of equity and total assets of the industry average company in 2009/2010, %
![Histogram: Ratio of equity and total assets of the industry average company in 2009/2010, % [Alexander Shemetev]](http://content.snauka.ru/web/6009_files/a9.jpg)
Let’s also look at the rate of growth of company profits in the industry for the year for a complete picture of the stability of the companies in the industry:
Histogram: The annual average revenue growth of companies in the industry in times of crisis 2009/2010, %
![Histogram: The annual average revenue growth of companies in the industry in times of crisis 2009/2010, % [Alexander Shemetev]](http://content.snauka.ru/web/6009_files/a91.jpg)
Most of all, the crisis is growing in FTAP industry (61.3%), AIC (16.2%), while A/C itself lost its third part; the crisis sector WWPincreases its profit indicators om 17.1%; the PPPPP is also profitable (the profit growth is 52.6%); the profit in WST sector grew in 75.7%; the profit in RetT is 37.8%; RE sector profit grew on 53.3%; EDU sector profit grew on 21.0%. The main buyer and a source of income for companies today is more and more shifts from industrial production to the consumer market. The main buyer and a source of income for companies today is more and more end-user – the non-industrial company.
A little later, the author of this paper will analyze the developed by him, by Alexander Shemetev, model called MACD and MICDsegmentation of the consumer market in Russia, according to the 2009/2010 years.
A10 - is the industry average ratio of revenue to total assets
The ratio of earnings to total assets – is the primary indicator of business activity of the company. The higher is the score – the more quickly a capital returns to a company. A10 indicator also shows the percentage of effective capital engagement of the company for a recent period (for example, 0.85 means 85%). The fastest business-activity we can see in education sphere (EDU) and retail trade (RetT), which have business activity from 3.96 to 5.15. High business activity of the industry have FTAP (1.31),TEX (1.41), PPPPP (1.22), WST (1.60), HOSP (1.75), SER (1.02). High level of business activity indicates the presence of a strong basis for the anti-crisis programs. This indicates a high level of share of sales of the company.
The lowest business activities have industrial industries and RE, which is associated with the specifics of their activities. Let’s now look at the Histogram in terms of A10.
Histogram: the industry average ratio of business activity of the average industry company in crisis conditions in 2009/2010, times per year
![Histogram: the industry average ratio of business activity of the average industry company in crisis conditions in 2009/2010, times per year [Alexander Shemetev]](http://content.snauka.ru/web/6009_files/a10.jpg)
A11 - is the industry average ratio of revenue to equity
Turnover of equity capital shows the business activity for the owners of capital. At the same time, the figure indicates how much, in average, revenue generates an enterprise to its owners.
Most of all revenue on this index is in retail trade (13.33) and education (8.05), which is associated with a structure shift in the national economy in the area of the consumer market, which, in its turn, evinces the demand for food, consumer products, education. However, high business activity of retail trade – is the specific industrial feature of this business.
Histogram: the industry average ratio of revenue to equity in an average company in sectors in 2009/2010, times per year
![Histogram: the industry average ratio of revenue to equity in an average company in sectors in 2009/2010, times per year [Alexander Shemetev]](http://content.snauka.ru/web/6009_files/a11.jpg)
A12 – is the industry average ratio of revenue to debt capital
Turnover of debt characterizes the company’s ability to pay for obligations to its creditors. It’s no secret that the revenue – is the main source of repayment for the business.
Because of this fact, the volume of revenue in relation to the loan capital is closely correlated with the degree of solvency of the company, thereby reducing the risks of bankruptcy.
Turnover of debt, on average, for companies of the national economy is approximately equal to or greater than 1, indicating a high potential for anti-crisis strategy. High revenues are in education, retail trade, HOSP, wholesale trade. This high revenue makes turnover of debt for these companies from 3.6 to 14.3. Let’s now look at the
Histogram in terms of the A12:
Histogram: the industry average ratio of revenue and debt capital of average in industry company in the middle of a crisis, 2009/2010, times per year
![Histogram: the industry average ratio of revenue and debt capital of average in industry company in the middle of a crisis, 2009/2010, times per year [Alexander Shemetev]](http://content.snauka.ru/web/6009_files/s27.jpg)
A13 – average in industries accounts receivable turnover term
Let’s start by looking at the Histogram in terms of A1 3:
Histogram: average in industries accounts receivable turnover term, expressed in days per year, 2009/2010
![Histogram: average in industries accounts receivable turnover term, expressed in days per year, 2009/2010 [Alexander Shemetev]](http://content.snauka.ru/web/6009_files/a13.jpg)
For all companies, the industry average accounts receivable turnover period is less than ’01 year, which is a positive trend. In education and retail trade the accounts receivables” turnover term is the lowest, which is associated with high revenues and relatively low relative to book value of company sum of accounts receivable.
A1 4 – average in industries accounts payable turnover term Let’s start by looking at the
Histogram in terms of A1 4: Histogram: average in industries accounts payable turnover term, expressed in days,
2009/2010
![Histogram: average in industries accounts payable turnover term, expressed in days, 2009/2010 [Alexander Shemetev]](http://content.snauka.ru/web/6009_files/a14.jpg)
The average maturity of payables and receivables by industry are roughly comparable. This suggests the possibility of a rational organization of the credit process so that the payments of the receivables would largely cover the obligations payable on terms. This can enhance the financial sustainability of companies in these industries. A15 – average in industries total assets” (company’s book value’s) turnover term Assets” turnover term is an important indicator of an industry.
The faster the capital of the company turns around, the more space the company has for its maneuvers. However, this turnover shows the ‘dirty” turnover term of book value. The EDU and RetT industries have the maximum total business activity, which can be explained by the high amounts of revenues among these companies relative to the relatively low amounts of their book values. The lowest business activity can be found, in a whole, among such sectors as A/C , FEC-1, FEC-2 , RMI ,MET, RE, WWP , Auto, CON.
In general in the national economy, the total revenue covers the book value of company less than for 800 days. There are 8 sectors (FTAP , TEX, PPPPP, WST , RetT, HOSP, EDU, SER), which have this term less than 1 calendar year. These companies, in case of crisis, – they have a good chance to take a leadership strategy for the costs, if the strategy of differentiation will not be able to justify themselves for particular firms. However, the high level of business activity does not mean higher net return on investment to the company.
Histogram: average in industries total assets” (company’s book value’s) turnover term, expressed in days, 2009/2010
![Histogram: average in industries total assets’ (company’s book value’s) turnover term, expressed in days, 2009/2010 [Alexander Shemetev]](http://content.snauka.ru/web/6009_files/a15.jpg)
A16 - it’s the industry average ratio of operating profit to costs Let’s start by looking at the Histogram in terms of A16: Histogram: the industry average ratio of operating profit to costs, 2009/2010, %
![Histogram: the industry average ratio of operating profit to costs, 2009/2010, % [Alexander Shemetev]](http://content.snauka.ru/web/6009_files/a16.jpg)
The high cost of production – is an important issue of the production process in domestic enterprises. The next enterprises can be distinguished among the most profitable in average in their industries: FEC-1, FEC-2 , RMI .
In average for these industries, the profit before taxes covers about a quarter of costs of goods manufactured.
A17 - is the industry average current liquidity ratio Let’s start by looking at the Histogram in terms of A16: Histogram: the industry average current liquidity ratio, 2009/2010
![Histogram: the industry average current liquidity ratio, 2009/2010 [Alexander Shemetev]](http://content.snauka.ru/web/6009_files/a17.jpg)
Current liquidity ratio for the average company in an industry varies from 1 to 2, or sometimes higher than 2. Current ratio shows how many times a company can cover the current liabilities from current assets” sources in the next reporting period, excluding the money supply turnover factor.
However, it is necessary to analyze the very quality of current assets, that is: – whether it’s liquid assets, or finished products, or accounts receivable (short-term, or, worse, long-term), or the stocks in general, and so on. Because of this fact, the absolute rate (instantaneous) liquidity should be used in addition to qualitative assessment. A18 - is the industry average ratio of the absolute (immediate) liquidity.
A18 coefficient shows how many times a company is theoretically able to cover all liabilities that arise in front of the company during the next reporting period, if the company is mobilizing liquid resources within 1 months of availability, that is, without taking into account the turnover of money supply factor.
In figure A18 is of the highest quality in terms of liquidity assets: Cash and cash equivalents – above all – short-term financial investments.
Histogram: the industry average acid-test ratio, 2009/2010 ![Histogram: the industry average acid-test ratio, 2009/2010 [Alexander Shemetev]](http://content.snauka.ru/web/6009_files/a18.jpg)
A19 - the industry average owned funds sufficiency ratio
Let’s start by looking at the Histogram in terms of A1 9:
Histogram: the industry average owned funds sufficiency ratio, 2009/2010
![Histogram: the industry average owned funds sufficiency ratio, 2009/2010 [Alexander Shemetev]](http://content.snauka.ru/web/6009_files/a19.jpg)
Negative values of the coefficient of own funds sufficiency is due to the fact that companies are in crisis, and, because of that fact, the basis of the book value of company is in fixed assets; at the same time, it is often so that the sum of the fixed assets exceeds the sum of equity capital. In Russia mostly the companies are closed from the equity market, and the stocks, when they are used – they are used mostly for providing the acquisition and merge procedures rather than to attract more investments through the shares at the stock market. At the same time, we discussed it earlier in this paper, the borrowed capital cost is too much high in Russia. In such conditions, the owned capital becomes much more stable in crisis conditions than the borrowed one. The A1 9 indicator is negative for most companies in the crisis conditions.
The A1 9 indicator is negative for most companies in the crisis conditions. The massive use of credit funds, which largely makes the coefficient of negative – this is normal for companies in crisis. The low rate of own funds” sufficiency is typical for industrial companies that are actively using borrowed capital and having a significant share of immobile operating assets in the book value. Re-equipment, reorganization, restructuring and such like anti-crisis procedures can be a real problem in the event of a severe crisis for such business systems. A20 - is the industry average ratio of fixed assets in equity
Indicator A20 shows how many times the cost of fixed assets exceeds the cost of equity capital. Let’s look at the
Histogram: Histogram: the industry average ratio of fixed assets in equity, 2009/2010
![Histogram: the industry average ratio of fixed assets in equity, 2009/2010 [Alexander Shemetev]](http://content.snauka.ru/web/6009_files/a20.jpg)
The companies from crisis sectors are highlighted in this Histogram: WWP abd Auto – the fixed assets” financing is more than in 50% based on expensive borrowed capital.
Assuming that equity finances only fixed assets, it turns out that, in addition to the above, the current assets of these companies are arbitrarily at 100% financed by borrowed capital. This creates a high risk of loss of ability to pay for those companies which need a tough risk management. A2 1 - it is an average-industrial indicator of production process results” ownership structure Indicator A2 1 indicates how many days the average company in the industry is working for its creditors, suppliers, lenders and other similar entities during a year.
The calculation is based on the theory of overlapping accounts of receivables and payables on the terms-and-sum-equal basis (ie the theory that the receivables are logically cover the payables” amount on a comparable scale). Then the current financial needs will be expressed in the value of costs” coverage required for production and sales during the year. The “frozen funds” are taken into account, which are suppressed by a comparable amount payable (the calculated CFN index – the current financial needs, which will be discussed in the section on financial analysis of my future book).
CFN, according to this theory, should be divided by the average daily turnover of revenue: to dete RMI ne how many days a year the companies are working on themselves, and how much – to cover their own current financial needs, ie, to pay to the creditors, lenders, suppliers, and so on.
Indicator A21 takes into account not all the “other entities to pay to” – just a few of them: the major suppliers, creditors and debtors, as well as it assesses sales” volumes. The system pays insufficient attention to borrowings from banks and para-banking system, other similar obligations, particularities of the manufacturing process which is not associated with the loan process (which is so reduced to management of payables and receivables and inventory); and also it doesn’t include other important factors that would further increase the theoretical term such company works “for the others”. However, the technique shows the presence of narrowly specific problems related to the organization within the business-system’s credit process” management at any company.
Companies of crisis industries like Auto and WWP work not for a long time “for the others” during the year. It testifies that the crisis inside such companies is caused due to the high volumes of simultaneously accounts receivables an payables, and also by the need to pay the loans and credits of banks and the para-banking system, and also by the need to pay other borrowings, as well as it is caused by the high costs of the production of such companies.
The negative value of the indicator A2 1 is caused due accounts payables, which cover both: inventories” total costs and accounts receivables value. At the same time, author of this paper, Alexander Shemetev, thinks the common credit process formula should be changed due to the fact the accounts payable coverage can be done by accounts receivables, and never vice-versa! The author of this paper considers the rate A2 1 should be made as follows: Dear reader, I’d like to make the further numeration of my formulas like in my Russian book, if you have nothing against it – let the next formula to be 502 and so on.
![Dear reader, I’d like to make the further numeration of my formulas like in my Russian book, if you have nothing against it – let the next formula to be 502 and so on. [Alexander Shemetev]](http://content.snauka.ru/web/6009_files/f502.jpg) (502)
(502)
Where: Inv – inventories; AP – accounts payable; AR - accounts receivable; Rev – revenue. I can explain my formula in the next way. The AR sum doesn’t show how many days a company works “for the others” – it shows how many days the others work for the company. At the same time, the AP sum doesn’t show how many days the others work for the company – it shows how many days the company itself work for the others.
The Inv sum shows the cost of goods and materials, which are purchased from the suppliers; the finished commodities and production in process (which is the part of Inv) indirectly shows the costs of raw materials that were purchased earlier, and also Inv sum indirectly reflects the transaction costs. Well, let’s see the difference between the classical theory of credit process results ( A2 1) and remade by me formula ( A2 1a) results:
Histogram: A 21 of medium-sized company sector, 2009/2010 ![Histogram: A 21 of medium-sized company sector, 2009/2010 [Alexander Shemetev]](http://content.snauka.ru/web/6009_files/a21.jpg)
Histogram: remade by Alexander Shemetev formula: A2 1a for medium-sized company of a sector, 2009/2010
![Histogram: remade by Alexander Shemetev formula: A21a for medium-sized company of a sector, 2009/2010 [Alexander Shemetev]](http://content.snauka.ru/web/6009_files/a21a.jpg)
The re-made by the author of this paper, Alexander Shemetev, A2 1a indicator reflects the actual time of the year, in days, during which the company operates for “the others”, covering the current financial needs of the loan process. Due to the current economic crisis and falling oil prices, companies in the FEC-2 sector had significant market share of products in installments, thus increasing, the rate of receivables up to such an extent that it exceeded the inventories” amount and the amount of accounts payables.
Thus, they owe much more to the FEC-2 sector companies, than the FEC-2 sector companies owe to anybody, according to the credit process. However, as you, my dear reader, remember, the loan process does not describe the whole structure of negative cash flow coming from, or, actually, to “third parties”. In order to evaluate the fact, how many days a year a company is working on others, the author of this paper, Alexander Shemetev, developed the following formula. The formula describes: how many days in maximum company works “for the others”:
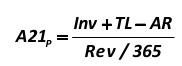 (503)
(503)
Where: Inv – inventories; TL - total liabilities; AR - accounts receivable; Rev – revenue.
The result of the calculation of the formula developed by the author of this paper, Alexander Shemetev, will show: how many days per year a company is working on others. This formula is more than adequate. First, the AR, is the entire amount of AR, including the long-term receivables and often restructured amount of debt, which can be returned in future by following the legal procedures.
All the borrowed capital (TL) represents the sum of the claims of creditors to a company. Short-term borrowed capital (a part of TL) – characterizes the value of a return within a year, which corresponds to the work for the “others”. However, long-term borrowing is repaid in part each year.
In addition, the long-term capital, as you remember, my dear reader, is charged the highest hidden interests, which significantly increases the actual total amount to be refunded. The author conducted research that showed that the amount of long-term debt optimal corresponds to the amount of claims by creditors for loans during the following period: long-term perspectives and implicit interest.
Histogram: a medium-sized company by sector in terms of developed by Alexander Shemetev’s A2 1p indicator, 2009/2010
![Histogram: a medium-sized company by sector in terms of developed by Alexander Shemetev’s A21p indicator, 2009/2010 [Alexander Shemetev]](http://content.snauka.ru/web/6009_files/a21p.jpg)
The next fact is clear from the above Histogram: some companies operate mostly “for the others” like: A/C (426 days per year),RMI (376 days per year), RE (355 days per year), WWP (320 days per year), Auto (298 days per year),MET (204 days per year).
This figure essentially bypasses the probable optimization transformations of financial statements, since all organizations are required to maintain surplus cash in the banks over the limit, therefore, the revenue is recorded more adequately than profit’s indicator in the financial statements even in Russia. However, there are additional indirect and direct costs of the company related to core activities, as well as costs associated with non-core business of firms that are not included in the formula A2 1P (503).
Accounting for these indicators may uncover more truly the term in how many days per year a company works for the others.
A2 2 – is the industry average ratio of net working capital ( NWC ) to assets for medium-sized company by sector, 2009/2010 Note that the index
A2 2 – is a legislative means stated bankruptcy prognosis ratio in Russia. The higher is the figure, the more stable is the company.
Let’s start by looking at the Histogram in terms of A2 2:
Histogram: The ratio of net working capital to total assets for medium-sized company by sector, 2009/2010
![Histogram: The ratio of net working capital to total assets for medium-sized company by sector, 2009/2010 [Alexander Shemetev]](http://content.snauka.ru/web/6009_files/a22.jpg)
The NWC value is negative only for medium-sized companies of the construction sector. Other companies have NWC , as a rule, more than 10% and less than 25%. Ultra-high NWC index can be seen in wholesale trade sector 30.8%.
A2 3 - is a measure that corresponds to the volume of the annual deficit on conditional loan process to assets for medium-sized company by sector, 2009/2010
According to the classical formula, the deficit is to be calculated as the difference between its own working capital ( OC(Eq) -ImmA ) and the current financial needs (Inv + AR - AP). It should be noted that the author of this paper, Alexander Shemetev, believes it is more rational to define the current fiscal deficit of a bit different conditional ratio for a single company (rather than the industry average for companies). The author of this paper, Alexander Shemetev, modified the formula to calculate the deficit in the next way:
![It should be noted that the author of this paper, Alexander Shemetev, believes it is more rational to define the current fiscal deficit of a bit different conditional ratio for a single company (rather than the industry average for companies). The author of this paper, Alexander Shemetev, modified the formula to calculate the deficit in the next way: [Alexander Shemetev]](http://content.snauka.ru/web/6009_files/f504.jpg) (504)
(504)
The author of this paper, Alexander Shemetev, developed this formula / in the classical conception they subtracted AP and added AR/ for more accurate dete RMI nation of lack of funds to the company. In this formula, first the fixed assets ( ImmA ) are subtracted from the equity capital – this is how we receive an obtained conditional value of own funds coming into the manufacturing process.
Current financial needs of the manufacturing process is the acquisition of stocks (Inv), repayment of debt (AP), part of which is quenched by the refund receivable (AR). Thus, it is a more rational analysis of the cash shortages, according to the opinion of the author of this paper, Alexander Shemetev.
The figure of A2 3 indicator, an indicator calculated by the classical formula, is given earlier in the integrated matrix system. Alexander Shemetev’s formula for funds” deficit analysis is to be used for an analysis of a company as the control number of concentration of cash flow for repayment; this control number is calculated from the credit process” amount of deficit.
The author of this paper, Alexander Shemetev, considers that for the developed countries, where the cost of borrowed capital is much lower than in Russia, and where the equity capital is usually more expensive than the owned one, one should transform the above formula in the next way.
In case with the most developed countries with low cost of borrowed capital one should add to OC(Eq) the sum of long-term liabilities (LTL) and then to subtract ImmA from this value. So, one should take the permanent capital instead of pure owned one in cases when borrowed capital is less expensive than the owned one.
A2 4 - is a measure of the average type of financial stability for a company by industry
The classical theory of financial analysis was used to estimate the average type of financial stability of a company. The author classified the financial stability at 4 types of rating:
A – This means the absolute financial stability;
B – This means a good financial stability;
C – This means a satisfactory financial stability;
D – This means an unsatisfactory financial stability.
It should be noted that in average for industries companies have a good or satisfactory financial stability. A2 5 - is a measure of discriminant company size (DRC) Sofie Balkaen’s conception was used to dete RMI ne the discriminant company size. Namely, in this paper, the discriminant company size is the amount of assets of the companies which was transferred to millions USD at the conditional rate30 RUR per 1 USD. Then the natural logarithm of the resulting index was taken. The more the discriminant company size is – the more stable is such company in a global perspective.
A26 - is a measure of forecasting bankruptcy for medium companies in the industry by the two-factor model of E. Altman The author of this paper led this indicator for clarity – to show that bankruptcy isn’t threaten to industry average companies in a whole. Each certain company should be analyzed in particular from the other companies.
A2 7 - A3 0 - it is averaged probability of bankruptcy of medium-sized company by industry; the averaged probability of bankruptcy was calculated by use the GSSC-model( A2 7), the model of Quebec ( A2 8), the modified Olson model by Harvard University ( A2 9 – total score of model, the A3 0 – the probability of bankruptcy) – it characterizes the risk of bankruptcy for a medium company in a segment of the economy
Let’s start by looking at the Histogram of the bankruptcy risk of average company in an industry in all these three methods:
Histogram: The index of the bankruptcy risk of the industry average company, 2009/2010
![Histogram: The index of the bankruptcy risk of the industry average company, 2009/2010 [Alexander Shemetev]](http://content.snauka.ru/web/6009_files/a27.jpg)
It is clear from the Histogram that the greatest risk of failure inherent in corporations and industries: Auto and WWP . High risk of failure inherent to the companies of sectors: TEX; A/C ; CON; RetT, and partly - PPPPP.
FEC-2 has a high probability of bankruptcy in connection with a high risk of the Harvard model, which is associated with a high book value (which indicates the monopolization of the market, besides, the big companies – they are mostly joint-stock corporations, that is why the negative trends can significantly affect the shareholders” decisions; also the other critical changes in the macro-environment may be also critical for the internal environment of such companies).
Also the bankruptcy probability for such companies is associated with the high amount of debt, the decline in operating profit by about one quarter of the year, the value of pure equity (net equity) less than 0. Thus, we considered, together with you, my dear reader, segmentation of the domestic market for companies in the sector. Let us now consider the model of the segmentation of the domestic market for consumers. Before it, let’s consider a little theory.
The introduction of financial marketing for anti-crisis strategy for the enterprise
Probably, it is impossible to talk about managing the enterprise and not to touch on the implementation of marketing. There is a lot of literature about marketing. If you prefer, you are be able to read any of available marketing literature.
It is necessary to say a few words about the difference between strategic and tactical marketing, before the story continue about the segmentation of the domestic market. The author of this paper would affect the subject in general aspect, in a nutshell. If you are interested in deepening your own knowledge in marketing – you, my dear reader, are able to read the literature on various aspects of marketing. Our purpose here – is to consider the anti-crisis management aspect. And it is quite simple: to use the entire arsenal of marketing in order to pull the company out of crisis, if the firm is not yet at the stage of bankruptcy administration, with which things are different…. So, there should be laid down two of the marketing plan to the company’s strategy in terms of economic instability: – a strategic marketing and operational marketing.
In general, the level of strategic marketing requires constant analysis of the market’s needs. Based on the analysis of the market needs, a company develops a strategic plan which includes products designed for specific customers, on one hand, and the specific consumer properties on the other hand.
The Times of Henry Ford are already passed, the Times, when he took into account customer preferences as follows: Ford will stain your car in any color, provided that you choose black! By the way, Henry Ford, more to this, sold the only brand of car to simplify manufacturing, using, thus, the strategy of mass marketing.
Strategic marketing – is the foundation of planning at the highest management level. The process of strategic marketing consists of five steps:
1) Identification of the underlying market.
2) Market segmentation (macro- and micro-). Segmentation refers to the separation of the market into groups of consumers according to their preferences for company’s products, ability and common desire to acquire it.
3) Analysis of the attractiveness of the market, which is necessary to dete RMI ne the market potential and the life cycle of products for a particular company in this market. It may be that the goods of this firm are already outlived its usefulness or will become obsolete soon, and maybe this commodity has not yet arisen in this market segment!
4) Analysis of competitive market conditions and the presence of sustainable competitive advantages at certain companies in relation to the other companies.
5) Choice of market strategies. Typically, a marketing plan – is the weakest point of Russian companies, both at domestic and foreign markets. At the same time, it is one of the most important activities of any company. Tactical marketing When the certain volumes of sales were planned on basis of strategic marketing, there starts the turn of tactical marketing, which aims to achieve the sales which were planned by a company.
Typically, tactical marketing achieves this through the use of practical tools, which are indicated by the notion of “4P”:
![]() Product – Product Policy – enterprise trade policy, which includes consideration of consumer qualities of the goods, which, in turn, differentiate it from other products that satisfy the same needs of society, and also it includes a policy to develop the product range, means of marketing support at different stages of product life cycle.
Product – Product Policy – enterprise trade policy, which includes consideration of consumer qualities of the goods, which, in turn, differentiate it from other products that satisfy the same needs of society, and also it includes a policy to develop the product range, means of marketing support at different stages of product life cycle.
![]() Price – Price policy – this pricing policy of enterprises, which sets the overall pricing strategy of the company and the competitive price of goods on the market. To dete RMI ne this, you need to know the level of demand for these products and customer sensitivity to price changes. This is set by market research. Costs of production and sales of products and competitors’ prices should be considered by an internal analysis of the enterprise and market analysis. On this basis, the company selects a common pricing policy that will dete RMI ne whether commodity prices are constant, or they will be subject to change at certain times, also it must dete RMI ne whether there will be planned price discrimination, the policy premiums and discounts, the strategy of high or low prices, and so on.
Price – Price policy – this pricing policy of enterprises, which sets the overall pricing strategy of the company and the competitive price of goods on the market. To dete RMI ne this, you need to know the level of demand for these products and customer sensitivity to price changes. This is set by market research. Costs of production and sales of products and competitors’ prices should be considered by an internal analysis of the enterprise and market analysis. On this basis, the company selects a common pricing policy that will dete RMI ne whether commodity prices are constant, or they will be subject to change at certain times, also it must dete RMI ne whether there will be planned price discrimination, the policy premiums and discounts, the strategy of high or low prices, and so on.
![]() Promotion – Promotion Policy (Sales Promotion) – Policies to promote products on the market. Promotion is forced at the expense of advertising, personal selling, sales promotion, customers” incentive programs, sales” chains development: from the circuit design of the production process to the end consumer and other methods. Sales promotion, as an effective marketing technique of sales, includes activities such as discounts, sales, contests, raffles, concerts, exhibitions, gifts, benefits and other events. The main objectives of this type of activity are to increase sales, increase the opportunity for the price policies performance, the formation of a positive business reputation and credibility of buyers to company’s products, new market shares capture and new market segments capture, as well as new markets capture, and so on.
Promotion – Promotion Policy (Sales Promotion) – Policies to promote products on the market. Promotion is forced at the expense of advertising, personal selling, sales promotion, customers” incentive programs, sales” chains development: from the circuit design of the production process to the end consumer and other methods. Sales promotion, as an effective marketing technique of sales, includes activities such as discounts, sales, contests, raffles, concerts, exhibitions, gifts, benefits and other events. The main objectives of this type of activity are to increase sales, increase the opportunity for the price policies performance, the formation of a positive business reputation and credibility of buyers to company’s products, new market shares capture and new market segments capture, as well as new markets capture, and so on.
![]() Place (Merchandising) – Sales policy of the enterprise. It meant by itself a development and use of the methods of marketing: direct (by an enterprise itself) or indirect (through intermediaries).
Place (Merchandising) – Sales policy of the enterprise. It meant by itself a development and use of the methods of marketing: direct (by an enterprise itself) or indirect (through intermediaries).
Basic principles of the Strategic Marketing Plan:
1) Review and consideration of all requirements, the state and dynamics of supply and demand of goods.
2) The maximum adaptation of strategies and tactics of the company to the market demand and to maximize the market demand’s satisfaction in the long run.
3) Make maximum parameters of the demand for the company’s products through all available means of marketing and other resources.
The operational and strategic marketing have five concepts on how to succeed in the marketplace. They further stated in the order in which they actually appeared in the world.
1. Production-oriented concept (1900s – 1930s) – Suggests that consumers are more sympathetic to the goods, which are prevalent in the market and affordable.
2. The concept focused on improving the product (1930 – the end of World War II) – suggests that the consumer will be more supportive of the highest quality products with better performance characteristics.
3. The concept focused on product sales (1940 – early 1960) – suggests an active marketing policy required to provide the necessary volume of sales, including through the incentives of consumers.
4. The concept of classical marketing (1960 – 1986) – suggests that the success of the company is the correct definition of customer needs and their satisfaction with more efficient method than the competitors have.
5. The concept of social-ethical marketing (1986 – present): – the author – Philip Kotler – adds to the position of the concept of classical marketing an assumption that it is necessary, in addition to the provisions of the classical concepts of marketing, also to care about the welfare of society as a whole. In this case, the company can rely on the goodwill of customers and a global long-term prosperity.
This is the latest marketing concept today. Summing up the concepts of marketing, we can conclude that the strategic and operational activities of the firm should be directed primarily at the company’s customers, their needs and concerns, and even – to independently create these needs in a society with predete RMI ned characteristics.
At the same time, the needs must be satisfied with a better way than competitors” ways. And also, it is very important to care about the welfare of society as a whole, such as environmental performance of production (eco-friendly food, toys, industrial production, and so on).
Strategic marketing provides a great advantage for the strategic plan of the company, because it gives perspective on sales in the long run. The total value of strategic marketing is huge. Tactical marketing depends on strategic marketing, and from it – sales, therefore, the volume of revenues to cover current needs; production depends on revenue, and profits depend on production, the profits, in turn, depend on the overall financial situation at the enterprise level and on threat of bankruptcy.
The segmentation of the consumer market and choosing the right target audience
Choose a target audience can be, for example, through a process of market segmentation. Segmentation – is identifying consumer groups in the general market that have interesting capabilities to the researcher, capacity and ability to buy goods company. Segment of the market must always be uniform, and differ from all others. For example, if a firm segments the market by one single parameter: the young married couples from 20 to 30 years, only they and nobody else should get into the target group; as well as the company will need to establish a set of consumer preferences, purchasing power, performance and other interesting for those customers factors. Each company has its own target market, that it should investigate.
Target Market – is a set of people with similar needs in relation to the goods of your company, who, at the same time, have sufficient resources to acquire such products; it is a group of people who are ready to buy some certain goods and who have sufficient resources to acquire it.
For the company, target market – this is the place where it can best realize its potential. Working with the target market for the company is always better than just working with the general, the mass market. If a company divides the market into segments, it can maximize the use and develop its potential, to stress itself, to capture the market, to obtain high profits, to earn a good reputation.
All successful businesses in the world have one feature and similarity: they all found that the target segment, which was ignored before they found it. Xerox found a market segment of copiers; Ford – found a market segment of car for a general audience, which was all ignored; IBM began producing computers for the general consumer; Apple started producing high-quality graphics computers; Toyota opened the economy car segment – a class that assesses maintenance; Honda – found fast motorcycles market, and settled a whole line of products bound with this production; McDonalds developed a quick-service segment of the market; Polaroid – a segment of instant color photos, and more. The list is endless: segments of digital cameras, cell phones, laptops, smartphones, mobile phones, movies, music, and other segments.
Every successful company has found itself in some segment, then developed itself in this some segment. The segment was regarded as naught before this some successful company came to this some segment. Less successful companies are already working in the field, in general, of developed before segments; and they found their own market niche, that is, the sphere, where some buying needs go unmet.
Even the store at the corner of your house – this is, probably, also the same unvalued by others segment – some other companies just did not notice it, some other companies just thought: “the game doesn’t worth the candles” because of the low purchasing power.
However, this shop has its own niche in the market which is undervalued by the others – a segment of buyers who want to buy groceries near their homes, sometimes 24 hours a day.
So the company can operate in one of three regimens, depending on the degree of market segmentation used: The first such scheme is mass marketing (no segmentation) – this is when the company operates on a single, massive or common market; such company doesn’t select or work with somebody special, with its target audiences. It is cheap in prior – the company does not spend additional money on marketing research…. At the same time …. Thee who spent some money for marketing research and who share this market with its segments – those companies may be much more successful, and they can push the less successful companies out of market. The second scheme is a single market segmentation.
This is accompanied by the identification of a single group of customers and by work with them directly, such as married couples. At the same time, the business risk is too great! What will happen to the firm if the only target audience stops buying products of this company for whatever reasons?
The third scheme is already a multiple segmentation of the market. It will never be complete – there will always remain not-identified-segments. With this scheme, the company identifies several groups of customers and works with each group individually. At the same time, the business risk is greatly reduced, and the cost of companies” marketing activities will be significantly increased.
Segmentation scheme is as follows:
![]() Establishing the principles of segmentation (eg, rigid);
Establishing the principles of segmentation (eg, rigid);
![]() Definition of segmentation methods (eg, cluster statistical analysis);
Definition of segmentation methods (eg, cluster statistical analysis);
![]() Defining criteria of segmentation (eg, gender, marital status, social status, family life cycle stage);
Defining criteria of segmentation (eg, gender, marital status, social status, family life cycle stage);
![]() Selecting the target market;
Selecting the target market;
![]() Establishment of target segments (that is, we have found and analyzed all the segments that meet the criteria put forward earlier);
Establishment of target segments (that is, we have found and analyzed all the segments that meet the criteria put forward earlier);
![]() Develop a plan for strategic and tactical marketing in business;
Develop a plan for strategic and tactical marketing in business;
![]() Promotion and positioning of a product in the target segment (product must be introduced to the market, and then it should be kept there);
Promotion and positioning of a product in the target segment (product must be introduced to the market, and then it should be kept there);
![]() Monitoring and evaluation of results.
Monitoring and evaluation of results.
Now, let’s examine the flip side or adverse effects of segmentation.
1) The effect of falling profits per unit of output. If the segmentation was done reasonably and objectively, then the company will maximize its profits. And if the analysis was done incorrectly, the profits of the enterprise may fall because the income needed for the target customer, who must be first found. The effect of this segment can be described as “wrong targeting” to the target audience, which means their preferences and purchasing power was assessed wrong.
2) The effect of deceptive segment value. It’s always difficult to dete RMI ne the magnitude and the purchasing capacity of the market segment for sure. Almost always there are differences in both directions: bigger one and smaller one …. it may lay some limitations to some company’s development.
3) The effect of underestimating or completely ignoring the market segment. This effect we have already spoken. These are misunderstood and ignored segments … and, at the same time, these are the segments the today world-leading companies were developed in! Such area is often for a successful business. At the same time, there are some difficulties with it. It is difficult to find, which may be a competitive advantage, because if it was easy to find it – this niche would be literally fulfilled with the competitors of all kinds.
Now it is necessary to say a few words about how to dete RMI ne whether the company has found its market segment. What are the criteria? Criteria for the market segments:
1) The large size of the segment, including sub-segments of the market, that is, the development of the segment. There can be made an analogy with the development of oil fields. Oil in such field should be enough to recoup all costs associated with its development, and to yield substantial profit. This is the main criterion.
2) The presence of differences between the segments. Segments must differ from each other on key indicators for customers; otherwise it is a single segment.
3) The similarity of consumers of segment with respect to certain goods. It is important to know how the typical segment consumer refers to the product in detail, what he or she wants when buying such product, what is the price he or she is willing to pay for it, what should there be in pre-and after-sales service, what additional services he or she wants to get, and in what quantities a customer wants to buy a product in this segment of each period, what are the characteristics of growth or decrease in the value of segment in the year, and so on. 4) Description of a typical portrait (or portraits) of buyers from this market segment. World’s leading companies are advised to make a list of at least 100 points.
These criteria are what the company wants to know about its customers in this segment. These criteria include, for example, financial position and wealth, consumer preferences, sex, age, stage of family life cycle, the presence of the effect of a snob in the segment (when a consumer wants to be not similar to other people when buying goods which should say this customer is different from all others), the presence of effect of confo RMI sm in the segment (on the contrary, the desire to be like everyone else), the presence of the effect of auto-preferences in consumer’s behavior (complete preference of auto-advertising-effect (relatives, friends), advertising and receiving an information through other communication channels with the client) and other characteristics.
5) Development of the planned channels of communication with the consumer (a spectacular sign, streamers, media, television and radio, newspapers, messaging and electronic communications, calls to the Consumer and from the Consumer, and even those channels of communication (relationship-building) as a smile, comfort, culture of service, and so on). That is to think about all that can bind customers to a particular company and to create a clients”-club for the firm.
One must now say how the market segmentation is going. There are three methods of market segmentation:
1) Statistical Analysis. First of all, this is the so-called cluster analysis of the market. This method is quite expensive, and therefore it is more commonly used in very large companies.
2) The second method suits for the general business, in which most companies dwell. This is customers” types” selection method with their subsequent grouping.
3) Mixed method. It involves the use of many target markets by a company so that each target market has its own method: a multivariate statistical analysis, or identification of types of consumers with their subsequent grouping. So, let’s focus on the most widespread method in the world market segmentation.
This method is customers” types” selection method with their subsequent grouping. It is widely accepted to group consumers by life cycle stages of the family. Also, it is widely accepted to group the goods themselves by life cycle stages of product on the market. Classically, the life cycle of a successful product is as follows:
1) The appearance of products in the market – the first, early buyers-innovators who like to try new things.
2) The massive entry of goods into the market – there are some buyers who saw a new product at their friends, acquaintances, relatives, and just third parties, who are also beginning to acquire the same goods. These are early imitators who mimic the very first customers.
3) Market saturation by product. Everybody who wanted to buy this new product – they bought it yet. There are only one massive customer type: people, who did not dare to do it before, that is, the later imitators.
4) The slow decline in sales of goods at the market. Only the most committed buyers buy the goods, these are those people, who earlier formed the Club of fans of this product, who also called as reactionaries or diehards.
5) Departure of goods out from the mass market.
It is characterized by a strong decline in sales, which will end with the fact that the market will remain only with isolated, custom-made copies of the product that will use the single-piece-demand.
So, VCR, lamp TV Tubes, the first computers and electronic-calculating-devices (electronic computers), first cars, …., – they all passed the whole product life cycle. Today there are only some pieces of vintage cars, gramophones, plates, video players, the first computers, and so on. By the way, some of these artifacts can afford only very wealthy people!
And there are products that are immortal, like Amoeba in nature, which only grows infinitely by dividing itself in half every time, and so they live forever without dying. For example these are such products as: a Food, above all, essential goods; luxury goods; real estate; agriculture products; some types of services and other similar products.
When some of the product line is no longer fashionable (eg, cakes with potatoes), there appears a new party, using the same product (eg, potato chips (fried potatoes with chemicals)). Very rarely, the life cycle of products from these groups is over – just by providing modified products to the consumer.
These products are mainly old as the hills. They hold on the market for a very long time. Therefore, competition among them is large, hence, profits may not be as big as some other products with lifecycles, and in addition, due to high competition and other factors, production and sale of these products involves certain specific difficulties; – primary, it can be so, that only some narrow professionals may be accustomed with overcoming of such difficulties.
However, the production of such goods often gives to a firm a “living income” that is, the constant cash that can be very important, for example, in industries that can’t see the cash for years, having, at the same time, significant gains; such like “living income” business could be a part of the business to diversify risks into these types of products, for instance, to receive an extra-liquidity.
So, when we dete RMI ned the stage of the life cycle of particular products, or dete RMI ned that some products don’t have a life cycle. It is fair relative to consumer groups. What are the criteria for segmenting consumer groups? They are regional, demographic and psychographic (lifestyle of the consumer). Firms can choose for themselves the criteria of market segmentation, which are most suitable for it:
Regional criteria:
![]() The geographical position of the region
The geographical position of the region
Feature of Russian regional geography is in the “offset” of the actual geographical center of Russia, the Central European part. Some regions have a priority position for the development of specific business sectors. Thus, the Siberian region is good for oil and gas business and for the forest; the regions of Yakutia are also still good for diamonds” “fishing”, for coal, ecology-clean-fish, gold; Black and White Sea have an advantage points in maritime markets; regions of the Far East, close to China, have an advantageous position for trade with it and with Japan, and so on.
![]() The geographical location of alleged points of sale
The geographical location of alleged points of sale
Outlets are usually located in one of the following parts of the region:
a) Business Centre. This is usually an old administrative or commercial part of city or town.
b) The regional shopping center. It is often located on the outskirts of the city, it is the main point of sales on total turnover, often supplying the entire regions of their products. In such places there are usually big stores or distribution centers, often there are located some shops and boutiques, as well as highly specialized shops.
c) A local shopping mall. This are the main shopping areas of the city or certain streets or places. They keep some boutiques and other shops in.
d) The shopping street. In general, each area of the city has a street which is an important transport or pedestrian mall, and which lures to itself the greatest number of buyers from the surrounding area or passing-by people simply being in this area.
e) The Department at a large store. Often, there are departments in large shops that lure their customers. For example, there may be memorabilia departments in the local sport-shops, or there can be CD-sale departments in grocery stores, as well as department of household chemicals, and so on.
f) The office version of proliferation. In every city there is an office space, or offices can simply be in any place. A firm must take into account in advance the location of points of sale in a particular region depending on the specifics of its activities.
![]() The transport network in the region;
The transport network in the region;
Russia has one key issue – it’s transportation (roads). So, the geography-and-transportation-factor is the core factor in both Russian delivery and sales. - It is important to take into an account next factors: the delivery of goods to your firm, the transport issues at different levels, – this should also be the basis to build different logistics networks and systems, that will help to a company to use the available resources in the most rational way. ![]() Climate Travel
Climate Travel
Agencies and agriculture companies are well aware of the value of climatic factors in the business. There is a business that is highly dependent on climate, and there is a business that is not much dependent on climate. In Russia, the climate zones vary greatly according to periods and seasons.
For instance, if some company has a business in Yakutia, it will be necessary to estimate the factor of the Yakutia region winter which can be colder than minus 65 degrees centigrade – it may make impossible to provide specific works by using the not-specified for cold technics.
![]() Legal barriers in the region
Legal barriers in the region
Now legal barriers become quite common both in the world and in Russia.
Legal barriers are a very important factor. For example, in Muslim countries, serious difficulties may arise when opening a bank branch there. In Russia, the restrictions are also strong.
For example, gambling and ‘sports Poker” is now pe RMI tted only in several regions of Russia. There are restrictions on certain advertising in each region and across the country, and other legal restrictions. Especially, they come into force when the company is working with foreign sector: an export-import restrictions.
![]() The development dynamics of the region
The development dynamics of the region
There are regions in the world whose economy is in a strong recovery (eg, China). And there are those in which it is declining, especially in a tough economic crisis conditions. Russia also has regions of the “rich” and “poor”, “wealthy” and “underprivileged”. Some regions are rich with certain resources or other factors. The dynamics of the region’s development has a strong impact to the market segment of a company that persists there: it may stimulate segment’s growing or shrinking.
It is always necessary to assess for strategic planning and market segmentation! There are other segmentation criteria, which will simply be listed by the author of this paper. I think, you will also be able to include in your analysis the remaining parameters:
![]() Media development;
Media development;
![]() The overall infrastructure development;
The overall infrastructure development;
![]() Environmental factors;
Environmental factors;
![]() The economic situation in the region.
The economic situation in the region.
egional criteria of your own region should be very familiar for you, my dear reader: climate, location, economic situation, dynamics of development, legal restrictions, infrastructure and so on. Therefore, we will not dwell on them, we will particularly focus on demographic criteria now.
The next group of factors of market segmentation – is demographic criteria.
Demographic criteria:
![]() Gender and age of graduation.
Gender and age of graduation.
The population of each country and each region is very different in age and sex structure. According to international business-standards, the entire population can be divided into male and female. It can also be divided into circa 8 age groups: infants (children under three years), preschool children (3 to 7-8 years), school-age children (7-8 to 15 years), Teens (15 to 25 years), Young people (25 to 40 years), middle-aged people (40 to 60 years), elderly (60 to 80 years) and senior age people (80 years and older).
In the near future, Russia will increase the share of total school-age children and adolescents. This is due to children’s Boom of 1999 – 2008, when the economy was in rapid ascent. At the same time, there are now relatively few children and young people, which is caused by a crisis in 90s – and it’s a negative factor for the work of special educational institutions, as well as for the general people staff in Russia.
Today, people born in the USSR (from the 60s beginning to late 80s) and Baby Boom children 1999 – 2008 are among the most influential categories that straightly dete RMI ne the market. People who were born before the 60s – they have weak purchasing power; they demonstrate demand today mostly for essential commodities.
Today people buy toys, food, school supplies, video games, computers and accessories, and more for children born in 1999 – 2008. Soon, they will need special educational packages in schools and universities, as well as job-places. It was again observed the decline in fertility in Russia since mid-2009.
Its size and trends one can try to estimate later. There are 54% of men and 46% of women in Russia, according to the 2008 statistics. The author of this paper gives you a statistics of population of Russia at the end of 2008, according to official data, broken down by eight age categories:
Table: gender and age grading of the Russian population as a whole for 2008
![Table: gender and age grading of the Russian population as a whole for 2008 [Alexander Shemetev]](http://content.snauka.ru/web/6009_files/w1.jpg)
Or it can be represented graphically: Schedule: The sex-and age-grading of the population in Russia in 2008
![The sex-and age-grading of the population in Russia in 2008 [Alexander Shemetev]](http://content.snauka.ru/web/6009_files/st01.jpg)
The main purchasing power of any region is precisely in the people of mature age who have already taken their place in life and have achieved certain heights. Dear reader, please take note that if you are not able to obtain and analyze the statistical base for your region, simply take those bases and put the people in your area (city, district or region where your company is present in Russia), in accordance with nation-wide indicators .
Thus, if the population of your market is one million, it means that you have, on average, 0.7% of the population who lives in our country (1 / 142 (%)). Then this region has, on average, circa 30 000 infants (3%), nearly 300,000 people of mature age (29.5% or 30%), it has 160 000 people who have higher university-level education, about 4,800 people who had divorced in this area and circa 9,000 married people, and so forth on the criteria which are interesting for you, my dear reader. This paper will allow you to “learn in the face” of your customer without any significant effort and, in principle, with averaged over Russia by smoothing method.
This, in turn, will maximize the mutual benefit of your interaction with your client, it will help you to follow the new level of inter-relations based on your cooperation with your clients to bring long term benefits and to withdraw any company from a state of crisis. That’s how things were in the sex and age grading of the Russian population at the beginning of the crisis (late 2008). Now, let’s see what has changed and how the picture looks like now. In 2010 the picture changed slightly.
Table: gender and age grading of the Russian population as a whole for 2010
![Table: gender and age grading of the Russian population as a whole for 2010 [Alexander Shemetev]](http://content.snauka.ru/web/6009_files/t22.jpg)
This matrix will allow you, dear reader, even better to know the customer of company in person. You can also follow the dynamics: what age group the population is moving. Therefore, you will be able to predict what will be your customer in a few years, as well as to forecast it for the long term.
Each age category has its own demand. Infants from birth to 2 years have some certain demands, from 2 to 4 years – the demand somewhat different. The girls demand one, and the boys – something a bit different. And so on. Let us see graphically the gender and age grading of the Russian population in 2010:
Schedule: The sex-and age-grading of the population in Russia in 2010
![The sex-and age-grading of the population in Russia in 2010 [Alexander Shemetev]](http://content.snauka.ru/web/6009_files/st2.jpg)
![]() Level of education
Level of education
The level of education of inhabitants of any country can be divided into five major groups: illiterate (no education), people with incomplete secondary education, people with secondary education, people with a primary professional (Initial vocational) education, people with secondary technical education (Secondary vocational), and people with Higher Education, which includes persons having a degree.
For example, in Japan for more than 99.2% of the population is educated; in the U.S. – less than 85%; the European Union has about the same picture.
There is also a contingent of people receiving any education, and therefore in need of certain goods.
Russia has one of the highest percentages of people in the world, having higher education or specialized secondary education. Education has of the strongest influences on the general needs of society as a whole.
Table: Distribution of the Russian population by educational attainment in 2002, thousands of people The level of education In 2002, thousands of people Structure, 2002, %
![Table: Distribution of the Russian population by educational attainment in 2002, thousands of people [Alexander Shemetev]](http://content.snauka.ru/web/6009_files/w2.jpg)
Schedule: The level of education in Russia
![The level of education in Russia [Alexander Shemetev]](http://content.snauka.ru/web/6009_files/st3.jpg)
Apparently, Russia’s level of education is very high. The perception of advertising, product acceptance, the consumer preferences strongly depend on the educational level of the target audience of business!
Let’s look at changes over the period from 2002 to 2010. The Russian statistics committee says nothing about the educational statistics after the 2002. The author of this paper, Alexander Shemetev, made his own research of this issue, based on the data of each educational institution in Russia. This information is the basis for the following table of data on education in 2010.
Table: Distribution of the Russian population by educational attainment in 2010, thousands of people
![Table: Distribution of the Russian population by educational attainment in 2010, thousands of people [Alexander Shemetev]](http://content.snauka.ru/web/6009_files/t24.jpg)
HPA>15 y.o. – is the human population in the age over 15 years old; HVE – higher vocational education – this is institute, academy or university-level education, including people with scientific degrees; Incompl. HVE – incomplete higher vocational education; SVE – secondary vocational education; InVE – initial vocational education. People who have specialized secondary or higher education, usually, in the first place, show the demand for general and specialist journals (eg, accounting), books and other literature, the services of tourist organizations and so on. It should be mentioned that 10% of the population of the Russian Federation on Statistics does not finish school (columns no education and initial education – some people studied only few years at school)! Perhaps, it is the fault to social problems: alcoholism, drug addiction, a socially disadvantaged population.
![]() The degree of income differentiation;
The degree of income differentiation;
Social differentiation – is an important indicator of social sustainability. Even John Maynard Keynes said: “/Nothing changes a person stronger than /social differentiation in relation to the strong depreciation of the money /”. Source of income of the population – it is work. Population works, first of all, in organizations distributed in the spheres of professional activity. However, some organizations, in the industry average, pay their workers much more than others. The result is social differentiation.
The factor of income inequality based on earnings in the company is one of the key reasons for the aggregate social differentiation. For example, in Japan the average level of social differentiation is equal to 10 (other estimate 16), according to the year 2008. This means that, on average, the highest paid employee in the country have only 10 – 15 times higher salary, than the lowest-paid workers in the country.
In the U.S., the degree of income differentiation can reach several thousands. This means that the highest paid employee, on average, several thousand times receives more income than the lowest paid (as of 2008). This differentiation in the U.S. is due to super-high salaries of top managers of leading corporations. At the same time, much depends on the method of estimation. Nevertheless, each method of estimation reflects some certain objective factors, processed through some certain algorithms. What happens here in Russia? Let’s look at the level of social differentiation of the population of Russia:
Table: Average wage of an average worker in the industry, according to the study of 97.6% of Russian companies in the industry in 2010, USD ($)
![Table: Average wage of an average worker in the industry, according to the study of 97.6% of Russian companies in the industry in 2010, USD ($) [Alexander Shemetev]](http://content.snauka.ru/web/6009_files/t25.jpg)
All the industries” names are given above I this paper. FIN – these are financial sector companies.
The minimum wage for workers can be found in A/C sector. AIC workers receive, on average, 12 168 rubles in months (1 USD is circa 30 – 32 rubles). The highest salary is typical for workers in the oil sector and financial corporations, particularly, banks. It should be noted that this salary is nominal, that is, without bonuses, allowances, gratuities and other support in various sectors.
This amount does not also include “gray wages” and “money in an envelope”, which are widely accepted in the Russian salary practice to reduce the tax base. The second important factor of social differentiation is the wealth of the population. People often confuse the concept of money and the concept of wealth.
Money by itself is not wealth – it is only the most liquid asset. Wealth corresponds to a certain level of human life. Economists believe that the external manifestation of wealth is the presence of the attributes of wealth and luxury accessories.
The author of this paper, Alexander Shemetev, made the domestic market segmentation on the concept of wealth in terms of providing various accessories of luxury, which are the basic attributes of wealth.
Histogram: Average personal luxury accessories in the Russian Federation in 2010, pieces
![Histogram: Average personal luxury accessories in the Russian Federation in 2010, pieces [Alexander Shemetev]](http://content.snauka.ru/web/6009_files/st4.jpg)
The housing (place to live) was considered in the conditional standard apartment of 50 m2. 0.45 means that the average person in Russia has a total floor space of 50 * 0.45 = 22.5 m2.
The low square of living place in ownership per 1 citizen is caused to extra-high prices for apartments in Russia. So, in Saint-Petersburg average 1m2 of apartments in the city center costs above 5 thousands USD per 1m2; in a city suburb minimum prize is 2,3 thousand USD. Averagely in all Russia, 1m2 of living place cost circa 1,67 thousands USD; the average cost of land outside cities to build country cottages is much higher than for the apartments.
The rest is calculated in units of attributes of wealth on a resident. The DVD players – is a bigger cluster that also includes outdated video-systems based on VHS format. PC – these are personal computers, including laptops, notebooks and other similar devices.
![]() Household Structure
Household Structure
Traditionally, the typical family consists of a typical successful husband, a happy wife and children, and sometimes their parents (family type A). In Russia today a family structure is not as common as of A-type. There are more and more families of other types every day like: a wife + kids (Type B), and very rarely in Russia Husband + kids (Type C), children abandoned by parents (type D), Husband + Wife without children (Type E), Husband + Wife + Children in a dysfunctional environment (type F). Increasingly, once formed the couples-people apart, divorced, or do not register their relationship; there are also pairs who either can’t or don’t plan to have children.
Each of these groups has its needs, its demand for goods, services and other products. Thus, people living alone or raising children alone, show the demand for small rooms and apartments, compact interior, furniture, compact and cheap home appliances, as well as cheap food, which they usually cook, or, less frequently, buy ‘semi-products with chemistry,” which requires no effort on the preparation for eating.
The main consumers of cheap alcohol are the types D and F, and expensive alcohol – types A, C and E. At the same time, the sale of alcohol destroys a society from within, so manufacturers of these products are faced with moral and ethical norms for their production. The main consumers of expensive and luxury cars are the types of families A and E in Russia, and average cost cars – are Types C families, cheap – Types B families.
Even the official statistics on marriages and divorces disappointing, at the same time, it completely ignores civil marriages and divorces and other similar incidents. The author of this paper gives you, my dear reader, the complete official statistics on marriages and divorces in Russia, from 1970 to 2007.
Table: Marriages and divorces in Russia for the period from 1970 to 2007
![Table: Marriages and divorces in Russia for the period from 1970 to 2007 [Alexander Shemetev]](http://content.snauka.ru/web/6009_files/w3.jpg)
As you can see, today, more than 65% (including civil divorce and dysfunctional families), the family types differ themselves greatly from the A type of family. This statistic also does not account for other single people, families and groups other than A. It should always be considered when segmenting the market, because, once again I repeat it, each group of families (A, B, C, D, E, and others) evince very different requests, preferences and purchasing power.
![]() The population of the region
The population of the region
This is also one of the most important indicators. Population dynamics is so, that by 2005 our planet is home to about 6.5 billion people, with an average growth rate of world population at 1.8% per year. If this continues in the future, by 2050 the world population will rise to 14.5 – 15 billion people.
Growth and development of modern technologies gives hope for the future for the majority of population of our planet: the new synthetic and genetically modified food production methods will be able to help poor countries with food – the main problem of the world society today.
Specificity of population distribution is so that the most economically underdeveloped regions of the world accounted for 76% of the world’s population, while the size of this population increases by an average of 2.1% per year, while the population in developed countries – growth only 0.5 – 0.6% per year. That is why it is practically difficult to create favorable conditions in undeveloped countries in terms of providing food, clothing, medicine and education. The population of the most developed countries is called the “golden billion” (currently 1.5), because it is the part of the world population who has the majority of all production facilities and the overall economy, as well as the standard of living of the population is large enough.
These are such countries as Russia, USA, China, Japan, the European Union, Canada, Australia and some other countries. Increase in the total population severely affects the business – the overall needs have constantly been increasing among the population of the Earth. At the same time, the standard of living of the poorest countries has not been much changing, where the most part of the concentrated population remains unchanged, hence, the total purchasing power of the most part of population of these countries does not change, although the population is growing.
The author is not accidentally turned China into the list of countries with high living standards. The fact is that Chinese law allowed a family to have just one child! And each such child must now have, on average, 10 – 12 relatives who watch over such children in every way: parents, grandparents, great grandfathers and great-grandmothers, aunts and uncles, and so on. Parents tend to give their children everything they did not receive in their times on a sufficient level like: good clothes, cars, computers, video games, toys, baby products, food, candies, and so on. So, many companies today evaluate the growing Chinese market as the most promising, especially the countries like the USA and Japan who wish to use this business-opportunity.
China – is of the fastest growing markets today. The population of Russia has gradually been declining: in 2008 in Russia, according to the official data, there were only about 142 million citizens! According to an unofficial data – this figure could be as low as 137,8 millions of people.
Even these numbers are supported primary due to both: the recent baby boom (1999 – 2009) and the influx of immigration flows to Russia, primary, from the Commonwealth of Independent States (CIS) and China. As a consequence, there is a gradual structural shift in demand among the population.
![]() Family Size
Family Size
In general, to achieve so the country’s population remained the same, that is at zero, every first family should have two children, and every second family – three (as there are many infertile people, people who are not ideologically inclined to make or have children, disadvantaged groups, child deaths and serious illnesses, as well as non-traditional models of family).
In Russia, the average person has 1 – 2 children – this is less than three.
There operates the family life cycle in such a model of family: pre-family period; childless married life, birth, kindergarten, school, teenage years and “the leaved nest”). Accordingly, each person, depending on the family life cycle, has the demand for different groups of products. Today, each 1 minor (child) in Russia (person under 18 years of age) has 3.98 adults. On average, each household has approximately a little less than 2 children (1.97 children), according to the year 2010. After the end of baby-boom in 2009 this figure will be faster decreasing from 2017th, when the babies born in the baby-boom period will reach an adult age.
The families with from-birth-to-school-children are the most numerous in Russia today, as well as the “the leaved nests” in various forms.
![]() Ethnic peculiarities of the market
Ethnic peculiarities of the market
There are some ethnic differences between the countries. And there can beMET something like two major poles: U.S. and Japan. All of Japan’s population is composed almost entirely of ethnic Japanese only. The population of the U.S.A. – is composed of all possible nationalities and ethnic groups in the world. So, the U.S. is often called the Melting pot /”Melting pot” (it is a big vat for melting metals/. That is, a place where all nationalities merge and mingle there. All other countries can be placed between these two poles on the ethnic composition.
Russia – is also a multiethnic country. It has a lot of different ethnicities and nationalities that make up the foundation of its national wealth. Russia also attends a lot of tourists from all over the world, which also affects the situation on market demand.
Firm is often necessary to take into account the ethnic characteristics of business. This is particularly important for areas of the hotel industry, restaurant and cultural services, hospitality and tourism.
Needless to say, that the representatives of these areas should be aware of ethnic and national characteristics of their customers, they should know about the foreign standards of service and hospitality which are adopted in different countries, at the same time, it is also desirable the personnel to know at least a few major international languages, or language of specific ethnic group, if Your company is aimed specifically at a particular ethnic group. Each national and ethnic group has its own specific needs and buying habits, which must be considered.
![]() Other Factors
Other Factors
We, together with you, my dear reader, considered the two of three groups of important factors for the market segmentation.
There is also the third group of factors, the psychographic factors that reflect the lifestyle of clients themselves.
Psychographic factors:
![]() Fashion;
Fashion;
![]() Fashionable trends;
Fashionable trends;
![]() Effects of consumers” snobbery, conformity and auto-preference (this is when a customer prefers the auto-advertising most of all /from friends, parents, husbands, wives, children, …./);
Effects of consumers” snobbery, conformity and auto-preference (this is when a customer prefers the auto-advertising most of all /from friends, parents, husbands, wives, children, …./);
![]() Social groups;
Social groups;
![]() The psychological personality types;
The psychological personality types;
![]() The motives of shopping;
The motives of shopping;
![]() What customers want to get from buying?
What customers want to get from buying?
![]() Other important for your company factors.
Other important for your company factors.
Each region has different psychographic factors. It will be you, my dear reader, who will have to identify these factors through the researches, personal experience, observations, peer reviews and other methods.
The more thought out and justified the segmentation of the market is – the more thought out is the very strategic and tactical part of the marketing of organization – therefore – the more effective the activities of company are to reach the most promising potential customers. Sometimes it also happens that the ultimate purchaser of the company – is not a person – is an entire organization! What if your company operates in the industrial market? In this case, the market should be segmented on the basis of commercial criteria for segmentation.
There are only five groups of such factors:
1) Factors of microenvironment of buyer and seller: The economic sphere of activity and sector; enterprises” sizes, geographic location.
2) Factors of the internal environment of the buyer and seller: Technology, Financial Resources, Focus of marketing and management, factors of intrinsic motivation of both real and potential workers, and so on.
3) The general model of commercial interrelations between buyers and sellers: What is the purchase/sale of goods, whether purchases and sales have their purchasing centers, what are the criteria for purchase, what are the additional conditions that are applied to a purchase?
4) Private commercial relationship model of buyer and seller (that applies to this particular situation): maturity, size, quality, delivery and payment terms.
5) The internal psychological qualities of leaders and company owners of organizations-buyers a company has interrelations with.
Market segmentation on these five groups of factors will allow you to get to know your seller or buyer, as well as to maximize your effectiveness in working with them. Sometimes it worth itself to think: what is better – to work through intermediaries to bring thine product to the end consumer or to start to work with consumers directly? After all, if it’s possible, then, probably, this is the way to follow.
Of course, everything depends on specific situations. Dear reader, always be aware that if your customers – are commercial enterprises, they, in fact, are derived and intermediary links in the chain of distribution of goods from you to the end user. Consequently, the demand of customers-such-like-organizations for your goods will always fluctuate much more than the fluctuations of demand of end consumers-users. That is, if the end-user demand has fallen by 10%, you can be dropped by one third.
And since the number of organizations-brokers is always below the number of end users, and it is significantly, there is always a real opportunity for your company to enter the market of the final consumers itself. As a general rule, any business is always profitable to operate without any intermediaries, if possible, in the field of companies. If it is not possible for any reason at this stage, the provided criteria for segmentation will allow you to get to know your vendors, organizations, as well as end users, and, therefore, your relationship with them will be much more fruitful. These are the aspects of market segmentation in marketing activities which cause the most trouble for domestic companies in Russia – that is why so much attention was paid to this theme in this paper.
Segmentation of the markets of Russia on their capacity; Alexander Shemetev’s method
Now let’s go back even closer to the financial management of marketing. I hope you remember the material that has already been given in this book. This will be important. Because here we discuss another aspect of the crisis of financial management, marketing – segmenting markets, not about the customers, but according to their capacity!
MACD Analysis (MACD ) -Market macro-environment strategic Analysis
In this chapter, the author of this paper, Alexander Shemetev, will offer you one more comprehensive methodology for company’s market macro-environment analyzing, which is also the know-how in this paper, and together with the above methods of analysis of the macro- environment, it is an important supplement section of the strategic financial management-marketing. The market is always a segment not only for its customers, and also on the overall market volume, according to the potential that it offers. You can beat all competitors in its industry, by becoming thus the only seller, and then …. Then, in the first place, you may have problems with antitrust laws. And, secondly, you can have problems with the capacity of the market for the goods produced in a non-competitive media (the quality of non-competitive goods, as a general rule, is much lower than of the competitive ones).
What is the point to hold a market share which “weighs” only $ 1000 a year? What do you think, what’s the answer to this question? In principle, even not-to-operate-at-all can be much better than to hold operating-in-zero-business or, even more so, to hold operating-below-zero-business – if it, of course, is so in the long run. In this case you, dear reader, will remain with the same zero without taking both risk and responsibility. Better yet is to take the Labor feat – to get a job where you work, receive a stable salary and where you don’t have to take a risk – it is much better than having unprofitable or disadvantageous business.
So, how to assess the market potential? The market potential is estimated based primarily on the fact: what a consumer buys and what are his preferences. So, if you create a purchasing-map of a typical Russian, it turns out that he or she spends money on food, transportation, education, clothing and footwear, housing, culture and recreation, and so on. Client – a consumer – spends some money on it all. The aggregate of all such funds from all clients in the country is a consumer market’s macro-segment, which is defined in terms of money. It is better yet to use also the notation in USD. Let us agree that in this paper the USD is circa 30 rubles. Then, based on this – you and your company can easily choose what is better to do business with in Russia. The author of this paper provides you with this data by the end of 2010.
The segmentation of the consumer market in Russia in 2010.
(In terms of total cash flow per 1 month)
![MACD: The segmentation of the consumer market in Russia in 2010. (In terms of total cash flow per 1 month) [Alexander Shemetev]](http://content.snauka.ru/web/6009_files/w4.jpg)
As it can be seen from the matrix, the largest consumer Russian market’s macro-segment, in terms of cash flows, – it is food. One percent of the market weighs 124.968 million USD per month, or 3.749 billion rubles, while the overall market weighs 12.496 billion USD in the month, or 374.88 billion rubles per month. This is the monthly cash flow of the nationwide market. As you can see, there are competitors for that fight. At the same time, it allows only a minimum level of consumption of a person who spends on food, purchased for cash, only 2640 rubles and 00 kopecks per month in 2010.
Sometimes I think that every person in Russia spends a lot more than the official 2640 rubles per a month! How do you think, how much each person spends in a month? The overall market growth over the years can be viewed on the minimum level – indicators of inflation in the country for years. This means you can predict all of these markets with their minimum rate of growth for any date both in the past and in the future. After the leadership segment, the next leading macro-segment is transport with its 15.67% of the consumer basket. 1 percent of the market weighs 72.58 million USD, or 2.17 billion rubles.
All market weighs 7.258 billion USD, or 217.7 billion rubles a month. Then there are utilities markets (housing services and communal services), culture and recreation, and other market segments. As it can be seen, the total weight of the total consumer market is 95.89%. Therefore, other segments of the consumer market (jewelry, luxury segment, and so on) are less than 4.11% of total cash flow. Each of these macro-segments has its own micro-segments. For example, the macro-segment of food has such micro-segments as: essential consumer goods, general grocery, related essential products, substitute-goods for essential goods, and so on.
In terms of economic instability, general cash flows of the market looks like this: increased by the value of the depreciation of money (the coefficient of market basket cost’s increasing, or you can take the inflation rate, GDP deflator, the rate of refinancing of the Bank of Russia, and other parameters for your choice). This matrix of cash flows from the consumer market’s macro-segments will allow you to navigate in the overall business-environment. So, if you take the total amount of revenue per month of a company, it will be possible to find the macro-segment of such company and to calculate what percentage of the total macro-segment’s cash flow such company has – this is kind of macro-share of market.
It can be calculated on a formula developed by the author of this paper, Alexander Shemetev:
![It can be calculated on a formula developed by the author of this paper, Alexander Shemetev: [Alexander Shemetev]](http://content.snauka.ru/web/6009_files/f505.jpg) (505)
(505)
Where: Σ – is the sign of sum; MACD - is the index of the overall share of your company in the market macro-segment, per month; TRm – Total Revenue (monthly) – The sum of the total revenue of your company in a month; TMSCF – Total Market Macro Segment’s Cash Flow – The sum of total cash flow of macro-segment for 1 month (presented in the table above, end of 2010). It should be noted that the data comes in terms of revenue for the MACD and MICD analysis” calculations, that is the sum of the gross receipts of the company. This is associated with the following. First, the macro-segments of the consumer market are taken for the analysis, which eliminates the need to detail the assortment range. Second, if a company does business in unrelated segments, having a single processing structure and a single resource base, such as Honda, when a company actually does this – it gives a strong competitive advantage to such company through diversification of activities – it, in its turn, should be reflected in fraction of occupied segment of the market as an additional airbag, on the one hand, and crisis stability, on the other. In case of withdrawal of competitors from the market, such a company will be able to capture additional market share. In order to transfer data from 2010 to future periods, such as 2011 or 2012 and onwards, it should be used, for example, the coefficient of inflation for the year. It must be done in the following order.
1) First, calculate the formula (505), shown above.
2) Then put the value obtained in (505) in a total annual figure. You can do this in two ways: a) Just multiply the value of (505) by 12 and you will get an approximate value;
b) Use the following formula developed by the author of this paper:
![Use the following formula developed by the author of this paper: [Alexander Shemetev]](http://content.snauka.ru/web/6009_files/f506.jpg) (506)
(506)
Where: MACD y – is a total annual value of the share of your company at studied market macro-segment; TR – Is the amount of revenue per year. 3) Then, multiply the value by the inverse of the discount index (DI). The index of the discount (DI) is calculated by a formula developed by the author of this paper:
![]() (507)
(507)
Where: DI – Discount Index – The index of the Discount. i – index of depreciation of money over time. This may be an overall annual inflation in the country, Central Bank’s refinancing rate, the rate of increase in the cost of consumer basket index, the GDP deflator, or any other indicators at your choice. n – is the number of last time of the Discount Index’s calculation (ID). ![]() Please note that the inverse of the discount index is calculated as the figure (1) divided by the index of the discount. 4) Then you should multiply the resulting amount you have on the overall MACD y discount index (DI) as shown in the formula below, developed by the author of this paper:
Please note that the inverse of the discount index is calculated as the figure (1) divided by the index of the discount. 4) Then you should multiply the resulting amount you have on the overall MACD y discount index (DI) as shown in the formula below, developed by the author of this paper: ![Then you should multiply the resulting amount you have on the overall MacDy discount index (DI) as shown in the formula below, developed by the author of this paper: [Alexander Shemetev]](http://content.snauka.ru/web/6009_files/f508.jpg) (508) Where: TMACD y – This is a general indicator of the total share of your company in the market segment for the current year. You can calculate it for the current date. These figures are very important to build the A-matrices, which are discussed in other publications of the author. Let’s look at some examples for illustrative purposes: Let the total percentage of a company N in the market X is 0.27% according to the end of 2010. In the rubles, it corresponds to the sum of conditionally 200,000 USD a year. Let us now calculate the conditional forecast of how much it would cost the occupied by the N company market share at the end of 2012, if an analyst believes that the share of the depreciation of money in 2011 is 14%, and in 2012 is 16%. When an analyst estimated this figures, the market basket increase rate plus premium rate for market risk were taken as an analytical base for the analysis. Then the rise in its market segment by the end of 2012 will be:
(508) Where: TMACD y – This is a general indicator of the total share of your company in the market segment for the current year. You can calculate it for the current date. These figures are very important to build the A-matrices, which are discussed in other publications of the author. Let’s look at some examples for illustrative purposes: Let the total percentage of a company N in the market X is 0.27% according to the end of 2010. In the rubles, it corresponds to the sum of conditionally 200,000 USD a year. Let us now calculate the conditional forecast of how much it would cost the occupied by the N company market share at the end of 2012, if an analyst believes that the share of the depreciation of money in 2011 is 14%, and in 2012 is 16%. When an analyst estimated this figures, the market basket increase rate plus premium rate for market risk were taken as an analytical base for the analysis. Then the rise in its market segment by the end of 2012 will be: ![]() So, now the company’s market share, under the given conditions of forecast, will cost 264.48 thousands of USD per year, which corresponds to a rise in price of 32.24% (264/200). Now let’s consider the second example. Let Annual revenue in 2010 amounted to 2400th.USD; and the company then held 0.27% of the market (which is the average share in 200th.USD, and annual – 2400th.USD). In 2011, its annual revenues were 2520th.USD, And in 2012 – 2546.4th.USD. Whether and how its market share was increased, if the minimum value of expanding cash flows of the market corresponds to the approximate value of declared inflation of 13% in 2011. and 10% in 2012. Overall, we are interested, first of all, in the company’s revenue for last year 2012 among these data. We are about to find the increasing share of the market. Let’s find the index of Discount:
So, now the company’s market share, under the given conditions of forecast, will cost 264.48 thousands of USD per year, which corresponds to a rise in price of 32.24% (264/200). Now let’s consider the second example. Let Annual revenue in 2010 amounted to 2400th.USD; and the company then held 0.27% of the market (which is the average share in 200th.USD, and annual – 2400th.USD). In 2011, its annual revenues were 2520th.USD, And in 2012 – 2546.4th.USD. Whether and how its market share was increased, if the minimum value of expanding cash flows of the market corresponds to the approximate value of declared inflation of 13% in 2011. and 10% in 2012. Overall, we are interested, first of all, in the company’s revenue for last year 2012 among these data. We are about to find the increasing share of the market. Let’s find the index of Discount: ![]() I should say that we know of only 0.27% of weight in the market. As you remember, the formula uses the very cost of market segment, that is, the cost (weight) of 100% of the market. The company forgot to specify it, and it is easy to calculate the proportion of it (509):
I should say that we know of only 0.27% of weight in the market. As you remember, the formula uses the very cost of market segment, that is, the cost (weight) of 100% of the market. The company forgot to specify it, and it is easy to calculate the proportion of it (509): ![I should say that we know of only 0.27% of weight in the market. As you remember, the formula uses the very cost of market segment, that is, the cost (weight) of 100% of the market. The company forgot to specify it, and it is easy to calculate the proportion of it (509): [Alexander Shemetev]](http://content.snauka.ru/web/6009_files/e22.jpg) We put up a sign of multiplication by 12, since this value is the value of cash flows of the market which is not taken for 1 month, but for the whole year. We can now find the true proportion of the market in 2011:
We put up a sign of multiplication by 12, since this value is the value of cash flows of the market which is not taken for 1 month, but for the whole year. We can now find the true proportion of the market in 2011: ![We can now find the true proportion of the market in 2011: [Alexander Shemetev]](http://content.snauka.ru/web/6009_files/e23.jpg) That is, despite the actual increase in earnings in the periods from 2010 to 2012, the company actually lost significant market share. If it had up to 0.27% of the market segment, now it already has only 0.2304% of the market, that is, a fall of almost 15% of market share! These examples have been given to you so that you become easier to navigate in what segment of the market is your company today, regardless of when it actually happens “today”. In fact, the entire strategic management and marketing, in the language of market segments, means what market share takes a company for today (if only it opens, then 0%), what percentage it should take and how to do it! I should say that the above problem can also be solved proportionate. Perhaps, this method of market share’s dete RMI ning, the market share which belongs to a company today, will be more likely for you to use and apply. First you need to find the index of discount (we have it 1.243). Then we should find a proportion:
That is, despite the actual increase in earnings in the periods from 2010 to 2012, the company actually lost significant market share. If it had up to 0.27% of the market segment, now it already has only 0.2304% of the market, that is, a fall of almost 15% of market share! These examples have been given to you so that you become easier to navigate in what segment of the market is your company today, regardless of when it actually happens “today”. In fact, the entire strategic management and marketing, in the language of market segments, means what market share takes a company for today (if only it opens, then 0%), what percentage it should take and how to do it! I should say that the above problem can also be solved proportionate. Perhaps, this method of market share’s dete RMI ning, the market share which belongs to a company today, will be more likely for you to use and apply. First you need to find the index of discount (we have it 1.243). Then we should find a proportion: ![First you need to find the index of discount (we have it 1.243). Then we should find a proportion: [Alexander Shemetev]](http://content.snauka.ru/web/6009_files/w6.jpg)
A small remark of arithmetic: I think, dear reader, that you are already familiar with the basic property of proportion – that multiplied crosswise (X) elements are always equal, like it is shown in our example. There are also some other properties of proportion that can also resolve this problem: like, for instance, to divide the both sides of proportion on the same number (2546.4) – this will not change the total proportion. We did so and received a reply in the manner specified above. This model shows the proportion of all major macro-segments of consumer market. It takes into account the overall value of consumer market’s macro-segments” cash flows. Cost and additional costs associated with the promotion and sale of goods, as well as other costs, – they are already very close to the issues of anti-crisis management, and these are not so much issues of a strategic anti-crisis Marketing-Management.
These aspects will be touched into my future book I am about to write. Also, this model considers just the consumer market, that is, the market, which is directly connected with consumers, with their consumable goods, which are included in the average consumer basket. The consumer market is not in any way affect such market segments as heavy industry, metallurgy, oil and gas market, the market for coal, timber, precious stones, precious metals, ores, and other such like industrial goods, which constitute the basis of Russia’s exports – this analysis estimates only the consumer goods, included in the average consumer basket. And one more note. As you can see, the “heavy” for its weight market – it is a market of food and food products.
The basis of this market is agriculture, the processing complex and its service industries. The total weight of Russian power market is 303 billion rubles per month, or 3.6 trillion. Rub. per year, which is a good anti-crisis solution for many domestic enterprises. This market can be much larger in volume, because the basis for this paper – is the average minimal estimation the Russian spends a minimum of 2640 rubles and 00 kopecks for food per month, according to the data at the end of 2010th. There are 142 million and 9,000 (2010) of food consumers in Russia / pessimistic statistics – 141 million and 920 000 (2010); unofficial pessimistic statistics: 137 million plus circa 5 million of constant living non-residents /.
As you can see, people need to eat always, – including in a tough crisis, when people need quality and affordable food, so this market has huge potential, especially when you consider the potential foreign mega-segment in the case of exports of food products in the future. There is another aspect of the strategic division of the market. If you calculate how much some company takes place in the market, when building strategic plans – just be careful! Indeed, for the development of a certain segment you may need additional loan funds. It’s one thing if it is agriculture and related industries, for which there is a state credit support and the likelihood of getting credit for “low” interest rates today. Another thing – if you are analyzing the enterprise sector – it is quite different. For the development of its market segment the company may want to take a certain amount of debt! As an analyst, be careful with credit facilities, – no matter what business you are connected with, just recall – there is always a chance for the owner of a company to become and to stay a “Millionaire in the reverse”, or “Millionaire with the sign minus”. This is how a famous French billionaire Jacques Borel become a millionaire in the red (reverse), who was a Harvard graduate with honors, known for his hyper-successes in business at the time; some of the world’s leading business magazines called him “Emperor Borel the First” before he became a millionaire in the red, trying to procure a significant share of super-profitable, as he thought, business of European hospitality, while taking a large amount of credit …. Often a company needed additional capacity to take the additional share of the market. At the same time, the questions on how to attract these funds an business-entity should be as cautious as an elephant in a china shop. Especially it should be so in Russia, where the equity market has huge specifics, the borrowed funds are extremely expensive as well as the PPE (property, plant and equipment to buy).
Now we will talk about another kind of analysis – strategic analysis of the microenvironment by means of MICD method, the method which also was developed by Alexander Shemetev.
Strategic MICD Analysis of the microenvironment (MICD )
MICD analysis, as well as the previous MACD analysis, is reduced to the analysis of the coefficient MICD (MICD ), which shows the percentage of your company in the study of the microenvironment of the business. By the way, do you remember what the MACD(MACD ) shows exactly?!
Those who carefully read the previous part of the paper and, at the same time, of the future part of future chapter of my future book – these people will easily recall this factor and the fact that it reveals! I am very pleased by your attention! Thank you for it! Thus, the MICD ratio shows the proportion of the company’s market in the microenvironment, the prospects for the industry, the maximum size of the market, the dynamics of growth and development, as well as the actual growth or loss of market shares of the company.
As you, my dear reader, remember, we saw an example where the company’s revenue grew rapidly up 2 years, and, at the same time, the company lost 15% of previously owned market! This is a very significant loss. To calculate the share of investigated by you companies on the market averaged – there can be used nation-wide indicators. For instance, one can calculate the developed by me MICD matrix which shows the rate of the market by numbering one million customers, based on the average nationwide figures. The segmentation of the consumer market in Russia in 2010. Averaged across Russia to the conditioned area of 1 million inhabitants (In terms of total cash flow for 1 month)
![MICD: The segmentation of the consumer market in Russia in 2010. Averaged across Russia to the conditioned area of 1 million inhabitants (In terms of total cash flow for 1 month) [Alexander Shemetev]](http://content.snauka.ru/web/6009_files/w5.jpg)
On average, the structure of the consumer basket remained unchanged – because the data were collected, on average, in the whole of Russia. The largest share still holds food and food market, then it comes transport, and so on. Now the weight of the market has declined significantly as compared with MACD macro-analysis of the market, from the last part. Now, one percent of the market of food products to the region of 1 million inhabitants weighs in 1020th USD (assuming that 1 USD is equal to 30 rubles).
And the total weight of the market in the month is 101.99 million USD, excluding the portion that comes from private farms in the 11.45 million USD, which will come from the private farms of citizens, and, therefore, will not represent the large commercial interest for the majority of companies. This matrix of flows of money markets in the region of 1 million inhabitants will allow you, dear reader, to navigate in the microenvironment of the analyzed by you business. So, if you take the total value of the company’s revenue and then you find company’s consumer micro-segment – you will know how many percent of the market has some certain business-system in its micro-segment which it actually occupies.
Then you can take the balance of your competitors (ordering it, for example, in the State Statistics Committee for a fee). One can trust to such indicator as revenue from balance sheet in Russia, since most of the companies reflect it objective, as it is required to keep all the money in banks in excess of established limits. If you divide main competitors” earnings by the total size of occupied together with them macro-segment – you will also know what market share they hold with a high degree of confidence, no matter whether they have any differences between the reported accounting and real finance, and to what extent.
These data are useful to us as to fill the A-matrix in the future, which will show the true cases in an industry among all the companies you will include to the A-matrix. Then, if you subtract the total the share of companies you have analyzed from the value of market’s micro-segments – the residual number which is obtained will reveal the other firm’s share at the market. It should be noted that if you first subtract the share of the company and its competitors from the total weight of the market’s micro-segments, the total number of market share that belongs to the other competitors will be positive. If you change the sequence of subtraction – you will have to use magnitude of the end number.
This should be done as shown in the following formula developed by the author of this paper (510) (calculated per 1 million inhabitants):
![]()
Where: | … | – sign of module (magnitude), which means that the number, resulting in the sign, is always positive. Drc - MICD rc – The share of other companies in this competitive market’s micro-segment; D – Share of analyzed by you company in this market’s micro-segment; D1, D2, …., Dn - MICD 1, MICD 2, …., MICD n – Shares of companies which are competitors of the company under your analysis in this market’s micro-segment: #1, #2, ….., #n.
TMicSCF – Total Market Micro Segment’s Cash Flow – total cash flow from this market’s micro-segment – this is the total amount of micro-segment’s cash flow, which, for example, you can see from the above MICD matrix (MICD ). This value comes from the calculation within a month. In order to calculate the value of a yeAr - it has to be multiplied by 12.
![]() The value of D (MICD ) can be calculated in rubles or in the percentage – the last shows what percentage of the market holds this particular company, or what is the “weight” of the market share which holds this company.
The value of D (MICD ) can be calculated in rubles or in the percentage – the last shows what percentage of the market holds this particular company, or what is the “weight” of the market share which holds this company.
As already mentioned, this value’s calculation is based on the assumption that there live one million inhabitants in your area. Almost every region in Russia is actually different in the number of residents from this number. This begs the question: how to calculate these figures for a certain region? Let your local Population is (P) residents. The number of P can be 100 people, it may be 1000, it may be 2 million, and so on. In order to dete RMI ne the total capacity of the market in your area, you need to multiply all the obtained figures by the segments correction coefficient, which is calculated by a formula developed by the author of this paper:
![Let your local Population is (P) residents. The number of P can be 100 people, it may be 1000, it may be 2 million, and so on. In order to determine the total capacity of the market in your area, you need to multiply all the obtained figures by the segments correction coefficient, which is calculated by a formula developed by the author of this paper: [Alexander Shemetev]](http://content.snauka.ru/web/6009_files/f511.jpg) (511) Where: P - Total number of customers in your area, you can take the region’s population; Ar - Adjustment Ratio – this is the market’s micro-segment’s correction factor number, which is calculated as the ratio of the consumer market segment like for the region with 1 million people in this model. In other words, this ratio helps you to apply the method of estimating region with 1 million inhabitants for any region with any number of inhabitants.
(511) Where: P - Total number of customers in your area, you can take the region’s population; Ar - Adjustment Ratio – this is the market’s micro-segment’s correction factor number, which is calculated as the ratio of the consumer market segment like for the region with 1 million people in this model. In other words, this ratio helps you to apply the method of estimating region with 1 million inhabitants for any region with any number of inhabitants.
![]() This factor has already been inserted in each formula in all formulas in the paper, where it is necessary to consider! Complex calculations are not required. Together with this, a good specialist needs to know how it is calculated!
This factor has already been inserted in each formula in all formulas in the paper, where it is necessary to consider! Complex calculations are not required. Together with this, a good specialist needs to know how it is calculated!
Thus, if the population of your region is 1 million people, this ratio is equal to one if the 2.5 million – that is equal to 2.5, and if, for example, 200 thousand people, then 0.2 (200,000/1,000 ,000), and so on. You can put customers and visitors, such as tourists, if necessary, to this ratio.
Then, each value should be adjusted to TMSCF at this value for all calculations. The above formulas use everywhere a market share of different companies. In order to calculate your share of the market or any other company’s share of the market in this micro-segment, you must use the below formula developed by Alexander Shemetev:
![In order to calculate your share of the market or any other company’s share of the market in this micro-segment, you must use the below formula developed by Alexander Shemetev: [Alexander Shemetev]](http://content.snauka.ru/web/6009_files/f512.jpg) (512)
(512)
Where: Σ – This sign means sum; MICD - index of the overall share of your company or someone else’s company in market’s micro-segment in a month; TRm – Total Revenue (monthly) – This is the amount of total revenues of analyzed by you or by somebody else’s company at the rate per month; TMicSCF – Total Market Micro Segment’s Cash Flow – The sum of total cash flow of micro-segment for 1 month (presented in the table above, end of 2010). Ar - Adjustment Ratio – This is market’s micro-segment’s correction factor number which is discussed above. We have already spoken on how to learn how to take into account the figures for different years. To do this, you should calculate the index of Discount (DI) (formula (507)), and then to translate the value to the average annual TMicSCF value, simply by multiply by 12. To do this, you can also use a formula developed by the author of this paper: ![To do this, you can also use a formula developed by the author of this paper: [Alexander Shemetev]](http://content.snauka.ru/web/6009_files/f513.jpg) (513)
(513)
Where: MACD y – This is a total annual value of share of your or of somebody else’s company in a market micro-segment; TR – This is the amount of revenue per year (line 010 of Form number 2 on OKUD: “Profit and Loss”). ![]() Then multiply the resulting amount you have on the overall MICD y discount index (DI) as shown in the formula developed by the author of this paper:
Then multiply the resulting amount you have on the overall MICD y discount index (DI) as shown in the formula developed by the author of this paper: ![]() (514) Where: TMICD y – This is a general indicator of the total share of your company in the market segment for the current year. You can calculate it to the current date. These figures, as well as indicators MACD y, are important for building the A-matrix. Now, let’s look it all at an example for clarity and ease of understanding. Suppose it is projected that a fairly large company N, which is in food market micro-segment, operates in the city of 2.5 million inhabitants. This company has annual revenues of 6.514 million USD by the end of 2012. It is investigated, that the major competitors of the company in this market segment can have annual revenues on the same period of 7.8 million USD (Company A), at 5.43 million USD (Company B), and 6.78 million USD (Company C) on the same date. We need to calculate what is the share of the market which will have this company, what are the shares of the market which can hold its competitors, and what are the shares of the market which can move away to other companies, to competitors. Let us do the calculations following the developed by Alexander Shemetev MICD analysis of microenvironment. The author gives examples of not by 2010, and for future periods to show how to calculate the matrix MICD to any period of time in the present and in future. Let the rate of inflation will account for the value of 13% in 2011 and 10% in 2012. So, let’s begin. Our matrix MICD is made in 2010. We should find the index of Discount: DI = (1+0.13)*(1+0.10) = 1.243 We should now find the value of correction factor in the micro-segment, Ar: Let us now forecast the share of each company in the market, using the following formula developed by the author of this paper:
(514) Where: TMICD y – This is a general indicator of the total share of your company in the market segment for the current year. You can calculate it to the current date. These figures, as well as indicators MACD y, are important for building the A-matrix. Now, let’s look it all at an example for clarity and ease of understanding. Suppose it is projected that a fairly large company N, which is in food market micro-segment, operates in the city of 2.5 million inhabitants. This company has annual revenues of 6.514 million USD by the end of 2012. It is investigated, that the major competitors of the company in this market segment can have annual revenues on the same period of 7.8 million USD (Company A), at 5.43 million USD (Company B), and 6.78 million USD (Company C) on the same date. We need to calculate what is the share of the market which will have this company, what are the shares of the market which can hold its competitors, and what are the shares of the market which can move away to other companies, to competitors. Let us do the calculations following the developed by Alexander Shemetev MICD analysis of microenvironment. The author gives examples of not by 2010, and for future periods to show how to calculate the matrix MICD to any period of time in the present and in future. Let the rate of inflation will account for the value of 13% in 2011 and 10% in 2012. So, let’s begin. Our matrix MICD is made in 2010. We should find the index of Discount: DI = (1+0.13)*(1+0.10) = 1.243 We should now find the value of correction factor in the micro-segment, Ar: Let us now forecast the share of each company in the market, using the following formula developed by the author of this paper: ![Let us now forecast the share of each company in the market, using the following formula developed by the author of this paper: [Alexander Shemetev]](http://content.snauka.ru/web/6009_files/f515.jpg) (515) Where: MICD y – is the market share, calculated at the rate per one year. Then the N Company’s market share is equal to: Full market share at the end of 2012 is (516):
(515) Where: MICD y – is the market share, calculated at the rate per one year. Then the N Company’s market share is equal to: Full market share at the end of 2012 is (516): ![Full market share at the end of 2012 is (516): [Alexander Shemetev]](http://content.snauka.ru/web/6009_files/f516.jpg) Where:
Where: ![]() - This is the total combined value of market’s micro-segment’s cash flow at any date for any region in the year (in this case it is reduced to 2012)! It is the 100% of specific micro-segment of specific consumer market in the region. Then the formula 515, on which we counted our company – can be written in a simpler form:
- This is the total combined value of market’s micro-segment’s cash flow at any date for any region in the year (in this case it is reduced to 2012)! It is the 100% of specific micro-segment of specific consumer market in the region. Then the formula 515, on which we counted our company – can be written in a simpler form: ![Then the formula 515, on which we counted our company – can be written in a simpler form: [Alexander Shemetev]](http://content.snauka.ru/web/6009_files/f517.jpg) (517) The share occupied by other companies in this market micro-segment in relative values is:
(517) The share occupied by other companies in this market micro-segment in relative values is: ![]() (518) Where:
(518) Where: ![]() - the market share owned by other unaccounted competitors;
- the market share owned by other unaccounted competitors; ![]() - Market share owned by taken into an account companies in the market’s micro-segment, in our example, this is the main company and its competitors: N A, B and C. The share of the market’s micro-segment of other companies in absolute terms is unaccounted for:
- Market share owned by taken into an account companies in the market’s micro-segment, in our example, this is the main company and its competitors: N A, B and C. The share of the market’s micro-segment of other companies in absolute terms is unaccounted for: ![]() (519) Where:
(519) Where: ![]() - Revenue of companies in the market segment, in our example, this is the main company and its competitors: N A, B and C. For our example, the share of other companies in the market segment is in absolute values: That is, this micro-segment is occupied neither by N, nor by any of its competitors which are taken into an account in this analysis. The selected for the analysis company can, in principle, take a significant share of this market through diversification. The main problem here – is to identify all sub-segments that make up this micro-segment of food. Let suppose that the companies N, A, B, C, and some of their direct competitors occupy sub-segment of the market, which is 2.5% of the total micro-segment of food – it was estimated by means of the general market research.
- Revenue of companies in the market segment, in our example, this is the main company and its competitors: N A, B and C. For our example, the share of other companies in the market segment is in absolute values: That is, this micro-segment is occupied neither by N, nor by any of its competitors which are taken into an account in this analysis. The selected for the analysis company can, in principle, take a significant share of this market through diversification. The main problem here – is to identify all sub-segments that make up this micro-segment of food. Let suppose that the companies N, A, B, C, and some of their direct competitors occupy sub-segment of the market, which is 2.5% of the total micro-segment of food – it was estimated by means of the general market research.
Then the competition mainly occurs in these 2.5% of this market micro-segment. It should be noted the competition also occurs in the areas of substitutes-goods, and in the sectors of potential competitors that could enter the market of N. In principle, roughly, the company has as many potential competitors – as many they are in the volume of the entire market’s micro-segment, in all its 100%. It is so due to the fact that any company of micro-segment, under certain conditions, is able to invade the market of N by diversifying its portfolio of assets, in the event that it considers the market of the company N is attractive. Yes, indeed, some companies will never do this for various reasons, and their number can be compensated by the new companies that don’t persist in the occupied by N Company market micro-segment yet. These potential competitors may also come at any moment to the N company’s market’s micro-segment, and, still worse, to the sub-segment of that company, that is, in this example: to those 100% or, worse yet, to the basic 2.5%.
That is why micro-analysis of the MICD model consists of two parts. In the first part, we analyze the entire micro-segments of consumer market to dete RMI ne its overall capacity. This potential is – just a priority, where, the company can develop largely through assets” diversification. In the second part, we analyze the sub-segments itself that are inside the consumer market’s micro-segment, that is, within direct competitors. So, let’s go back to our example. Our sub-segments is only 2.5% of total micro-segment of market of food products in the region of 2.5 million inhabitants. Then, let’s apply the formula, developed by the author of this paper: ![]() (520) Where:
(520) Where: ![]() - The total amount of the investigated sub-segments, expressed in monetary units. α – fraction of “Alpha” micro-environment of business, ie, it is the percentage, the share which is occupied by the sub-segments of investigated by you company in general market’s micro-segment. That is, in fact, it is the size of the main field of competition in the market. The specified share of the “alpha” is dete RMI ned by complex market research in an occupied by company area. If the company takes more than one region, it makes sense to split the company’s activities on the individual components among the regions of presence. If you do not have these opportunities, you can do it roughly, approximately, at your discretion. In our case this value will be:
- The total amount of the investigated sub-segments, expressed in monetary units. α – fraction of “Alpha” micro-environment of business, ie, it is the percentage, the share which is occupied by the sub-segments of investigated by you company in general market’s micro-segment. That is, in fact, it is the size of the main field of competition in the market. The specified share of the “alpha” is dete RMI ned by complex market research in an occupied by company area. If the company takes more than one region, it makes sense to split the company’s activities on the individual components among the regions of presence. If you do not have these opportunities, you can do it roughly, approximately, at your discretion. In our case this value will be: ![]() That is, it is that part of the market, where the main competition is. Our company is constantly fighting for the distribution of 51.7 million USD profit in its sub-segment. Then the market share will be calculated from the formula, developed by the author of this paper:
That is, it is that part of the market, where the main competition is. Our company is constantly fighting for the distribution of 51.7 million USD profit in its sub-segment. Then the market share will be calculated from the formula, developed by the author of this paper: ![That is, it is that part of the market, where the main competition is. Our company is constantly fighting for the distribution of 51.7 million USD profit in its sub-segment. Then the market share will be calculated from the formula, developed by the author of this paper: [Alexander Shemetev]](http://content.snauka.ru/web/6009_files/f521.jpg) (521) Where: MICD (SUB) – this is the company’s share in the occupied sub-segment of the market.
(521) Where: MICD (SUB) – this is the company’s share in the occupied sub-segment of the market. ![]() - Is the sum of the company’s revenue for the year. For our company, the shares they occupy in the sub-segment of the consumer market’s micro-segment are:
- Is the sum of the company’s revenue for the year. For our company, the shares they occupy in the sub-segment of the consumer market’s micro-segment are:
So, these are the shares of the major players inside this market sub-segment. The total amount of sub-segment’s shares which are not busy by other competitors are (they are calculated by the formulas developed by the author of this paper): In relative values: ![]() (522) This is a general formula for calculating the relative shares of the sub-segments of the market, where:
(522) This is a general formula for calculating the relative shares of the sub-segments of the market, where: ![]() - The total relative amount of market positions that are occupied by unaccounted competitors in this sub-segment of the market. In our example, this value is:
- The total relative amount of market positions that are occupied by unaccounted competitors in this sub-segment of the market. In our example, this value is: ![]() That is, it is unrecorded market share taken by unaccounted competitors. Absolute values for calculating the overall market share of other firms are calculated using the formula developed by the author of this paper:
That is, it is unrecorded market share taken by unaccounted competitors. Absolute values for calculating the overall market share of other firms are calculated using the formula developed by the author of this paper: ![]() (523) This is a general formula for calculating the absolute shares of the sub-segments of the market, where:
(523) This is a general formula for calculating the absolute shares of the sub-segments of the market, where: ![]() - It is the total absolute amount of market positions occupied by unaccounted competitors in this market sub-segment.
- It is the total absolute amount of market positions occupied by unaccounted competitors in this market sub-segment. ![]() - It is the amount of the proceeds of accounted companies in the market (in our example, these are companies N, A, B, C).
- It is the amount of the proceeds of accounted companies in the market (in our example, these are companies N, A, B, C).
In our example, this value is: ![]() That is, these 55.514 million USD – This is exactly the size of the market that is not occupied by the N Company’s competitors who were taken primary in the analysis.
That is, these 55.514 million USD – This is exactly the size of the market that is not occupied by the N Company’s competitors who were taken primary in the analysis.
Marketing of the insolvent company
However, you, my dear reader, can easily meet an insolvent company among a range of solvent ones. These-like insolvent firms, along with the aforementioned arsenal of tools, are necessary a deeper study of behavior policy in the market to avoid bankruptcy or takeover.
The purpose of marketing, operational and financial performance of loss-making and, especially, of an insolvent company – this is the use of all means of marketing to overcome the crisis. Summarizing this part of the chapter, you can say the following. There are two types of crisis companies:
Fully insolvent enterprises and enterprises located in a tough crisis. If your company is completely insolvent, then the whole business-arsenal of marketing and management needs to give a special priority to tactical and operational marketing management. The aim here is only one: to ensure that the level of sales would be at a certain point in this period by all the means of tactical marketing, which can be designated with the 4P abbreviation, which we considered in more detail earlier. In any case, in short, let me repeat, that the particular attention should be paid to product policy, pricing policy, sales policy and policy of promoting products on the market. Trade policy of the insolvent company can be effectively built on the basis of ABC – analysis, where
A - Goods that have principal demand. Such company should make focus on them.
B – These are goods for which demand is not very high, and it falls. Insolvent company need to find a replacement for B in series of product A, it should be done to release them into the market and to dampen gradually the fading in the goods B by completely replacing them with a group of goods A. Goods
C – These are almost gone from the market products, demand for which may be even greater than A or B, and they do not bring much revenue to the enterprise. Such products must be kept at a minimum level of demand, just to keep customers. According to the ABC-analysis concept, a company needs to keep the maximum number of products A in the assortment range – and, at the same time, a company needs to direct marketing efforts to sell products of A group. A group goods are easy to learn.
They are easy to learn even in the case, when your company’s product range has only few of such commodities – they will always take the main burden of profit for themselves, that is, they are the most profitable products of the enterprise. B group goods must be kept firstly in the event when, for whatever reason, they are related products of A (for example, the photo-cameras (A) and memory cards (B), clocks (A) and batteries (B), etc.), to attract customers. If possible, replace to A group as many B and C group goods as possible by all means. The main accent should be done at A group goods sales stimulating and sales. If your business is in trade and sales – then it will be advisable to apply in addition to the ABC-analysis the XYZ-analysis for a more comprehensive analysis.
XYZ – this is the error prediction, which is expressed by the variance and standard deviation from the statistics. Standard deviation shows our risk. And XYZ-analysis shows the probability of error in the calculation. It is calculated analytically.
X – it is a group of products, the error in the calculation for which is less than or around 10% – 15%. That is, if your company is planning, that a commodity will be bought by 10 clients this week – then, if it actually belongs to a group of X – just one or, at most, two of 10 clients may not to buy this commodity this week.
Y – it is a group of products, the error in the calculation for which is around 15% – 30%. That is, if you have planned, that a certain product for a week will be bought by 10 clients, in this case 2 – 4 people may not to buy it. And it is for sure, that, at least, the others will buy it this week.
Z – it is a group of products, the error in the calculation for which is 30% – 50% and above. That is, from our ten people, for example, 6 may not to buy a product for this week. ![]() It should be noted that, for each specific company and industry in general, these probabilities can be their own and differ from each other, as well as the demand may be its own and differ from other demand due to specific of both business and industry itself. Then, trade policy of trade-and-sales-oriented-company can efficiently be designed based on the ABC-XYZ matrix:
It should be noted that, for each specific company and industry in general, these probabilities can be their own and differ from each other, as well as the demand may be its own and differ from other demand due to specific of both business and industry itself. Then, trade policy of trade-and-sales-oriented-company can efficiently be designed based on the ABC-XYZ matrix:
Table: ABC-XYZ matrix
![Table: ABC-XYZ matrix [Alexander Shemetev]](http://content.snauka.ru/web/6009_files/abcxyz.jpg)
Thus, all groups of goods of trading company are included in this matrix of commodity policy of an enterprise. We so obtained nine product groups, each of which is necessary to develop a common commodity policy. General recommendations are as follows:
AX Goods – these are the most important products for the enterprise as it is easy to build sales forecasts with minimal errors. Immediately, just after the production, such products do not lie long around shelves of the local stores and at the warehouses of finished products. Consequently, they can be produced with a reserve to have additional reserve to stimulate demand for these products.
AY Goods – these are also the most important products for the enterprise. And due to difficulties in forecasting the demand for them, you must have insurance stocks in case the demand for the period will increase itself dramatically.
AZ Goods – this product brings large revenues and profits.
And it is too difficult to plan it, because the demand is unstable and prone to strong vibrations, especially in times of crisis. Additional analysis is needed for this group of products, especially if they are basic for the business. The purpose of such analysis is to know the customer of this product in their “face” to build on this basis the future plans: how to stimulate demand for such goods, how much it should be produced or purchased, and even they should ask if they have a need for this product or if they can replace it to some other product.
BX Goods – although they do not yield significant profits, they still can form the basis of the product range of company by the number of purchased goods.
The probability of selling is high. The demand for these goods is known and can be easily predicted. It is, therefore, necessary to produce or procure such goods accordingly to the demand for it. At the same time, there is the need for powerful marketing research on how to replace the products of the BX group to the products of A group, so that this new product would both fall under the consumer’s choice and satisfy the same needs of the consumer at the same level or at a more advanced level. At the same time, it is necessary such goods to bring higher income to company.
BY Goods – the likelihood to sale this product is known only approximately. It doesn’t bring special income to a company. It is necessary to analyze the market to find a replacement of these goods for A group goods, and for now, it is necessary to store it in accordance with the minimum demand to hold the customers.
BZ Products – this product just needs a change for group A. A market analysis is necessary to know what consumers prefer. The likelihood of a sale of BZ goods is small.
CX Products – for your company such goods mean that the probability of selling it is big, and it will not bring you an income. You should hold it only if it is related to the A group goods or just to draw the attention of potential customers to your firm. It would be better for the enterprise if they found a substitute from A group for such products.
CY Products – the probability of sale is questionable, and no income! CZ Products- the probability of sale is even more questionable, and no income at all. If there was a possibility – you should refuse to use such products.
Commodity trading company policy should focus on market analysis, on search and implementation of AX, AY, AZ, BX commodity groups in exactly that order of importance for the enterprise.
It is important to seek a replacement, if possible, for the rest of the goods, and it is best of all to replace them for A-group commodities. The more A-goods a company has – the better it is for the company, and vice versa. One should market them in all possible ways and methods of marketing – management.
The price policy of the insolvent company. It is constructed on the basis of evidence of demand and the principles of profit maximization. In my first book we looked at the company called “Luck” when it tried to maximize its profit by changing the price in each period based on a profound marketing research and profound internal capacities research. It is rather a big theme for discussions, so I ask you to look up to there, if it is possible.
In general, each company will have to choose: a strategy of high mark-ups at a low volume of sales, or a strategy of low margins with high volume sales. Of course, it would be good to join them both – this is like a philosophers” cornerstone in marketing today, so, I think, nobody still knows how to do this. Although insolvent companies choose themselves a variant of the mixed between these two strategies – a strategy of price differentiation, when they sell a part of goods with no extra charge to get rid of them and turn them to revenue and also to attract some customers with cheap prices, and some products are to be sold with a more substantial mark-up for, of course, group A of commodities.
The policy of promotion of products to the market of an insolvent company The implication here is the manner in which the insolvent company to motivate their customers to purchase goods from it. Often, companies at this stage resorting to personal sales as a way of marketing policy and simultaneously to motivate its clients. Also, the policy of promotion of products includes: Advertising, Auto-advertising, PR and other methods. In general, companies should always promote their products in every way possible to the market.
The policy of promoting products and marketing policy of an insolvent enterprise rests completely in the sales” forecasting model: to help us bring our goods – there may be used ABC-analysis, and to know the likelihood of their sales (forecast errors) – there may be used XYZ-analysis. You may ask me, what are the models to predict sales, in general? The answer is next. Sales forecasting is divided into three stages: the first is an overview of the enterprise environment, then there are developed the forecasts for an industry and market segments, and finally, the forecast of the sales of a company.
1) Forecasting sales based on an analysis of past experience of the company or companies in the industry as a whole. It is better to take the data on sales in this market segment as a whole.
It is typically used with different multivariate statistical models, cluster analysis, dete RMI nation of smoothing (eg, exponential smoothing), and other methods. You can also use a general economic analysis, or an overall statistical analysis of demand. On the other hand, it is not always possible to predict the future by completely focusing on the past! Therefore, an arsenal of analysis should also complement other methods of sales” forecasting.
2) The method of peer review. Expert evaluation can always be of two kinds: to Trust to the experts or to provide an analysis by your own means. One shouldn’t trust the experts in all occasions and always, at the same time, experts may give very valuable advices for a company, so it is important to listen to their views for any business. When the analysis is provided by company’s internal means all the experts are in use, which you can draw from the inside. The method of peer review is conducted in the external and internal environment of the enterprise. In domestic environment, it is carried out as described in my publications on investing in company’s own production. External analysis is carried out by segmenting the market, and not so much by statistical methods.
These is done by methods that we have already discussed with you – the methods of Market segmentation by identifying groups of criteria: regional, demographic and psychographic factors. We have already discussed above how this division is provided.
3) The study of consumer demand.
There conducted researches in coordination with buyers for the probability of making purchases of goods in your organization and that they expect to get when buying your products, as well as what financial resources they have. The author of this paper suggests you to use also the method Marketing Test of Thematic Apperception (MTTA), in which case consumers are shown pictures related to your company’s products, outlets, etc. – there should also be the opportunity to try it, and then they are asked what spontaneous emotions, feelings, experiences, preferences, and so they have at the moment. I need to say you that the term “ask” means the use of wide range of psychological means.
Then all the factors are divided into two groups: those that like to consumers and those that do not like to them. The factors they don’t like – you should get rid of them. Also, if a factor is irrelevant to the consumer, it is also desirable to remove and replace it to the positive one. Buyers are selected from those targeted market segments that are targeted by your marketing strategy for the MTTA.
MTTA participants should be in a good mood before testing – for this you have to pick up the benevolent intentions, politely, coffee, etc. You can also use the method of questioning, although in Russia, in my opinion, this method is not particularly effective due to the lack of specialists in questioning themselves. Besides, questioning has negative perception by people in Russia due to specific factors. At the same time, there is also an inability to reach for your segment by a questionnaire in Russia. And there are other factor that prevent questioning in Russia. You can use the client polling. This is actually the same questionnaire, which is conducted within the circle of customers of the customers” club, where members express themselves through the survey compiled in the form of questions regarding to their opinion about your product.
4) The direct test of the market.
This method is used primarily for new products, which this market has never seen. Or, it can be used if you have a new market for your product, or if you are working with a new major wholesale buyer of a commodity, or if you have opened a new wholesale distribution network.
There should be made a trial batch to run to the market. Opinions, statements, comments, negative and positive assessments of future clients of the firm are important for you. Then the next analysis is made based on analysis of sales of the test batch: is the market ready to buy this product, or too much effort is needed for those sales. It also may happen: that the market did not perceive a new product. Then we must search either for other market, or to abandon this product. The direct test of the market allows producers to keep themselves more insured from serious errors! 5) Analysis of the competition.
You can carry out sales forecasting with one more way: through the analysis of competitors. Analyzing their product range, pricing and levels of demand for the product can be a powerful market research and the basis for the sales forecast of specific goods.
This method has one disadvantage: if customers bought it from competitors – it is not the fact that this product would be bought from your company! Besides, dear reader, please, note: the author of this paper advises you to choose the most successful competitors in this market segment. Now, it must be said that, in addition to a group of insolvent companies, the companies from the crisis industries can also be regarded as crisis-companies. The anti-crisis marketing – management must go exactly as described in previous text and in the chapter of my future book in English I will write soon.
An important indicator of insolvency is a loss-making of company, that is, the inability of companies to generate net profit from their activities. The following is an integral matrix system of the industry average performance of loss-making companies by branches of the Russian Federation.
![An important indicator of insolvency is a loss-making of company, that is, the inability of companies to generate net profit from their activities. The following is an integral matrix system of the industry average performance of loss-making companies by branches of the Russian Federation. [Alexander Shemetev]](http://content.snauka.ru/web/6009_files/t34.jpg)
Notes to the matrix system: LMC – a designation for loss-making (non-profitable) enterprises in various industries; % LMC – a designation for loss-making (non-profitable) enterprises in various industries (in percentage to the total number of big companies in this industry); Apod – Accounts payables which are overdue the terms calculated at 01 crisis-company in the industry, thousand rubles; Arod – Accounts receivables which are overdue the terms calculated at 01 crisis-company in the industry, thousand rubles; N – is the total number of companies by branches in pieces that had losses; Δ – this symbol means change in some figure like: ΔN - absolute change in the total number of unprofitable companies (ΔN positive means there became more unprofitable companies over the year, while the negative ΔN indicator means there became less unprofitable companies over the year in some industry); ΔN(%) – relative change in the total number of unprofitable companies, expressed in per-cents. PBT - Profit Before Taxes of an average loss-making-company in an industry, thousand rubles /each 30 rubles is circa 1 USD/; Aver – average indicator for non-profitable companies among all the industries of Russia (this is the average-arithmetical without the statistical weighting operation).
Losses mean negative operating profit. The total number of loss-making companies in these sectors of the Russian Federation in 2009 was 1,016,935 companies.
Gross loss of loss-making companies in the economy at the beginning of 2010 amounted to 612,317 billion rubles at the assessed industries plus circa 432,084 billion rubles from companies which don’t belong to the described in the matrix-system industries. On average, a loss-making company has 578 thousand rubles of the loss. Let us consider the following Histogram :
Histogram: The share of loss-making companies in the industries of Russia in percentage of the total number of firms, 2008
![Histogram: The share of loss-making companies in the industries of Russia in percentage of the total number of firms, 2008 [Alexander Shemetev]](http://content.snauka.ru/web/6009_files/s45.jpg)
Histogram: The share of loss-making companies in the industries of the Russian Federation in a percentage of the total number of companies, 2009/2010
![Histogram: The share of loss-making companies in the industries of the Russian Federation in a percentage of the total number of companies, 2009/2010 [Alexander Shemetev]](http://content.snauka.ru/web/6009_files/s46.jpg)
In overall, the number of loss-making companies in the economy has gradually increased due to the economic instability, which began in August 2008, with the exception of a few industries, such as RE, WST , EDU, FEC, FTAP , PPPPP. In Russia, the concept of loss-making companies is closely linked with overdue accounts receivable and payable on a comparable scale. Overdue accounts receivable of one subject in the economy are directly and closely correlated with the amount of overdue debts of another entity. Thus, this may stimulate a chain reaction of defaults and causing the effect of acceleration in the economy.
Acceleration is the basic cause of inflation in the economy, on the one hand, and the loss of significant parts of the solvency of some companies on the other. Unprofitability is the basis of insolvency. Unprofitability for several periods in a row virtually guarantees insolvency, ie, the debtor can’t pay its debts to creditors. And this is the beginning, or continuation of …. the stage of an open or legal bankruptcy for the company.
Marketing on the basis of multi-parametrical models
The application of these models can be justified only in companies whose product is positioned in the market as a single purpose (narrowly-specialized). In this case, the rigid requirement to follow one of two strategies is removed. Such company may combine both of these strategies: cost leadership, and tools that are suitable for differentiation (Leadership for the parameters). The opportunity to combine them persists only for companies of this sort. For example, the Sterling Pore company took its segment of production of extra-strong laces, cordages, ropes and spikes for climbing shoes, including the production of nano-fibers. A SWS (Screen Wiper Solutions) corporation sells a variety of shape, size and parameters of the brush to clean the glass, including automotive glasses.
The demand for the products of these companies is peculiar, that is why it requires a comprehensive analysis. On the other hand, we must simultaneously seek opportunities to reduce costs. The issues on how to conduct such-like analysis were already discussed in this paper. To find out how to do so the multi-parametrical models to be applied for the mass market – it is the philosopher’s stone of financial management and marketing. The leading researchers have tried and are trying to find this philosopher’s stone in all times….!
One of the models of the philosopher’s stone can be called a model of Chan W. Kim and Renee Mauborgne, 2005 /Harvard University, USA/, which identified a strategy of “Blue Ocean” by contrasting it with the strategy of “Red Ocean”, in which there are many competitors, a fierce struggle for survival and, therefore, the need in all the financial mechanism with the most modern achievements of science. Blue Ocean – is endless series of innovative businesses, which are highly specialized due to their innovativeness, since there is no one who produces such products. Thus, these authors have reasonably believed that when implementing the venture project, the initial positioning of a product will pass through a series of strategies that can be described by multi-parameter models so that the product from the first time to be highly specialized.
The disadvantage of a blue ocean strategy is that a potential high yield correspond to potential high risks in the case of innovative venture projects, which, again, require a whole arsenal of financial science to manage …. The Blue Ocean Strategy authors” see risk management through the prism of the fight against the “three beasts”:
1) Attracting customers who use a similar, and not this innovative product;
2) Work with the client’s audience that potentially prefer not to mess with the company’s market and not to use such innovative products;
3) Involvement of undecided customers who are completely outside to implement those product to satisfy their requirements. According to the model developers, Blue Ocean Strategy is based on an analysis of utility to the purchaser of a new product, on the choose for a reasonable price for the customer, on the analysis of the possibility of profit, on the analysis of ways of moving goods to market.
Although, in fact, venture capital projects risk management, – it is much more complicated process than other industries” companies” risk management, otherwise all the world-leading companies would have to apply this technique.
The question concerning the application of strategies specific to a narrow market segment for all products intended for the broader market – it continues to be the Philosopher’s stone, one of many such-likes.
However, the using of the developed by the author of this paper A-matrix is applicable for the whole arsenal of the market strategies, which is yet another attempt to discover the secret of the Philosopher’s Stone ….