![Sofie (Sofia) Balcaen's photo [Sofie (Sofia) Balcaen]](http://content.snauka.ru/web/5254_files/balcaens.jpg) |
|
Sofie (Sofia) Balcaen |
![Hubert Ooghe's photos [Hubert Ooghe]](http://content.snauka.ru/web/5254_files/oogheh.jpg) |
|
Hubert Ooghe |
Hubert Ooghe and the Sofie Balcaen – are of the most famous professors of Belgium. They teach and conduct research at the University of Ghent in Belgium. Their range of interests – bankruptcy of commercial companies.
Hubert Ooghe and Sofie Balcaen at the Ghent University in Belgium carried out a series of studies towards the applicability and inapplicability of the basic methods of bankruptcy forecasting. They managed to comprehensively analyze the applicability and inapplicability of the basic techniques of forecasting bankruptcy. As a result, they smashed all the errors contained in the models, in which they identified two types of error: the so-called errors of type 1 and type 2 errors.
They studied the existing methods of bankruptcy forecasting models like: W.H. Beaver 1967, E. Altman 1968, the methodology of Co (Japan, 1982), the method of Fisher (Germany, 1981), the R. Taffler and G. Tishaw methodology (Britain, 1977), technique of E. Altman (1974, France), a technique of Fernandez (Spain, 1988), Swanson and others methodology (Argentina, 1988), E. Altman and P. Narayanan technique (1997), H. Ooghe and E. Verbaere technique (Hungary, 1982), H. Ooghe, P. Joos and De Vos D. technique (Belgium, 1991). In addition, they examined a number of scoring and rating techniques to predict bankruptcy: E. Altman (1993), Bella (1990), P. Joos, H. Ooghe and others (1998), the Kankaanpää-Latirena methodology (1999) and other methodologies. They also examined a number of models to predict bankruptcy, which have no classification features of basic types of bankruptcy prediction models, such as a model of Mossman (1998).
Hubert Ooghe, Sofie Balcaen, as well as some other scientists within over 20 years have been investigating the applicability and inapplicability of the various models and methods of forecasting the companies’ bankruptcy in different countries. As a result, there were selected a number of models to predict on maximum the probability of bankruptcy. Then they managed to fix several Class 1 and Class 2 bugs for these models, so that the probability of bankruptcy prediction of each model was from 91% to 96%. The authors propose to conduct a study of bankruptcy based on their models which were adapted by them among the best models to predict bankruptcy.
Hubert Ooghe and Sofie Balcaen believe that the company is bankrupt, depending on the failure of three main cycles of activity. First failure cycle makes the investment cycle breakdown – this model predicts failure of up to 3 years before bankruptcy. Then, the second failure cycle makes an operating cycle breakdown – the model predicts failure of up to 2 years before bankruptcy. After this, failure goes to financial cycle by making its breakdown – this model predicts the failure of up to 1 year prior to bankruptcy.
The author of this paper made a research to complete this Ghent university study so it could forecast bankruptcy on the basis of all the Ghent University’s research experience without concentrating on some unique model. The author of this paper also reviewed the components of the Ghent’s university research so it to be applicable for the cases when it is unknown whether the primary financial data is clear or is transformed for making some optimization of company’s activity performance. On the one hand, such interpretation makes the model applicable in the normal occasions, on the other hand, it makes the abnormal occasions comparable with the normal ones.
The most promising models, in the opinion of H. Ooghe and S. Balcaen, are next: a model of E. Altman (1968, USA), Bilderbeek Model (Amsterdam, 1979), Ooghe-Verbaere Model; Christine Zavgren’s Model (1985, USA); Gloubos-Grammaticos logistic-discriminant analysis (Greece, 1988); K. Keasey – P. McGuinness Model (1990, England); P. Joos, H. Ooghe, De Vos D. Model (1991, Belgium).
Each model is re-formatted by H. Ooghe and S. Balcaen and other scientists so that they can now predict the bankruptcy of all three cycles: the investment (3 years prior to bankruptcy), operational / production / (2 years prior to bankruptcy), financial (1 year prior to bankruptcy).
Among the countries that fell under the action of models: there were several Russian companies, companies in the U.S., in Britain, in Germany, in Belgium and in other countries. Total models were tested on tens of thousands companies around the world.
Authors of Ooghe-Balcaen technique had also examined the types of errors in the bankruptcy prediction models, and they concluded that all the errors in the bankruptcy prediction models can be divided into two types: type 1 and type 2.
Type 1 errors related to incorrect assessment of “credit risk”, when a firm is classified as a bankrupt, – when company is not bankrupt.
Type 2 errors are related to “commercial risk”, when a not-bankrupt-firm goes to be classified as a bankrupt.
I will write an analysis for each model under the old and the updated variant. So let’s start to consider them.
I) E. Altman’s Z-component in the Ooghe-Balcaen model
1) The “old new” method of E. Altman in 1968, the United States.
a) Model of the crisis of the investment cycle: 3 years prior to bankruptcy:
![]() (319)
(319)
Dear reader, if you are not against it, let use my Russian book numeration in the formulas. So, the beginning of the numeration will be from 319 equation (it is in the beginning of my book in Russian).
For all models: X1 – is the ratio of NWC: Net working capital (current assets minus current liabilities) to total assets (TAS)
![]() (320)
(320)
X2 – the ratio (amount of profit / loss during the reporting period (P/L) and retained earnings of previous years (REPY)) to total assets (TAS):
![]() (321)
(321)
X3 – a measure of profitability. The numerator is earnings before taxes and interest / EBIT /, at least equal to the sum of operating profit (PBT – Profit Before Taxes), plus the interest paid (070 line (070) in the profit and loss account plus oversized interests (%%), interest that cannot be attributed to the 070 line / for example, the rate of more than 12.75 – from late 2010 to early 2011/). The denominator is the book value of assets (TAS):
![]() (322)
(322)
X4 – a ratio of the cost of equity capital (OC(Eq)) to total liabilities (TL):
![]() (323)
(323)
X5 – is the ratio of revenue (Rev) to total assets (TAS):
![]() (324)
(324)
The critical point of the model – is +0.0229 or less.
b) Model of operating cycle crisis: two years prior to bankruptcy (325):
![]()
The coefficients X1 – X5 – are defined in the previous model of bankruptcy.
The critical point of the model: +0.0221 or less.
c) Model of the crisis of the financial cycle: 1 year prior to bankruptcy (326):
![]()
The coefficients X1 – X5 – are defined earlier.
The critical point of the model: less than +0.0190.
2) A new method of E. Altman 1968, the U.S.
a) Model of the crisis of the investment cycle: 3 years prior to bankruptcy (327):
![]()
The coefficients X1 – X5 – are defined earlier.
The critical point of the model: less than +0.0574.
b) Model of operating cycle crisis: two years prior to bankruptcy (328):
![]()
The coefficients X1 – X5 – are defined earlier.
The critical point of the model is: – 0.1203, where “–” – is a minus sign.
c) Model of the crisis of the financial cycle: 1 year prior to bankruptcy (329):
![]()
The coefficients X1 – X5 – are defined earlier.
The critical point of the model was: – 0.1757, where “–” – is a minus sign.
The results of testing this model (old and new).
When testing revealed 6% error of class 1 and 3% error class 2 (an additional 5% error) in predicting bankruptcy in ’01 before the failure.
When testing detected 28% of the errors of class 1 and 6% of the errors of class 2, and 17% additional error in predicting bankruptcy through the operating cycle crisis.
When testing detected 52% of the errors of class 1. Other classes of errors were also found.
The purpose of the model: the prediction of economic bankruptcy under the court decision.
Forecasting Object and Conditions: large industrial enterprises, predicting the probability of bankruptcy through the court procedure. The method predicts bankruptcy, depending on the industry and asset structure.
Type of analysis: linear discriminant analysis.
The number of species of the technique: 5.
Primary sample period for the analysis of the original model: the company for 1946 – 1965 years (19 years).
The Altman’s models calculation is just the very beginning of the Ghent university (Ooghe-Balcaen model) complex models study. The second element of the model is the adjusted J. Bilderbeek model (Amsterdam, The Netherlands, 1979).
II) J. Bilderbeek Z(B) component (Amsterdam, The Netherlands, 1979) in a model of Ooghe-Balcaen
1) The “old new” J. Bilderbeek model, 1979
a) Model of the crisis of the investment cycle: 3 years prior to bankruptcy (330):
![]()
For all models: X6 – a net gain or net profit / NP / (after tax) in relation to equity capital (OC(Eq)):
![]() (331)
(331)
X7 – the ratio of accounts payable (AP) to revenue (Rev):
![]() (332)
(332)
X5 – was discussed earlier, in the models of Altman (Rev / TAS).
X8 – the ratio of gross value added (GVA) in total assets (TAS). Please note that GVA – a value added created during the reporting period, which represents the difference between the revenue (Rev) and the cost of raw materials and services from third parties. It is believed that GVA is allocated to salaries, dividends, interest, and so on. GVA – a term of management accounting. GVA shows the value of the product on a book or other fair value less than cost of raw materials, as well as direct works and services cost required for the production. As applied to Russian account, this figure can be regarded as Revenue – Cost. Revenue should be adjusted by the amount of revenues and expenses not related to production activities of the company directly: transaction, interest, non-operating and so on, which under the accounting policies are projected through the revenue. Thus, we expect revenues from primary production activities, to then deduct the cost of production. Thus, the index is equal to X8:
![]() (333)
(333)
X2 – the calculation of this indicator is shown in a model of Altman:
![]() (334)
(334)
The critical point of the model is: less than – 0.4955, where “–” – is a minus sign.
b) Model of operating cycle crisis: two years prior to bankruptcy (335):
![]()
The coefficients X2, X5, X8, X7, X6 – are explained earlier.
The critical point of the model is: less than – 0.8523, where “–” – is a minus sign.
c) Model of the crisis of the financial cycle: 1 year prior to bankruptcy (336):
![]()
The coefficients X2, X5, X8, X7, X6 – are explained earlier.
The critical point of the model is: less than – 1.5495, where “–” – is a minus sign.
2) A new J. Bilderbeek technique, 1979
a) Model of the crisis of the investment cycle: 3 years prior to bankruptcy (337):
![]()
The coefficients X2, X5, X8, X7, X6 – are explained earlier.
The critical point of the model is: less than – 0.0737, where “–” – is a minus sign.
b) Model of operating cycle crisis: two years prior to bankruptcy (338):
![]()
The coefficients X2, X5, X8, X7, X6 – are explained earlier.
The critical point of the model: more than + 0.4924. When this figure is taken more, it mostly matches to reveal facts of primary data discrepancies to make the firm within the selection comparable.
c) Model of the crisis of the financial cycle: 1 year prior to bankruptcy (339):
![]()
The coefficients X2, X5, X8, X7, X6 – are explained earlier.
The critical point of the model is: less than – 0.2145, where “–” – is a minus sign.
The results of testing this model (old and new).
In the Bilderbeek model 1 year before the bankruptcy the type 1 and 2 errors were found, and there is not a typical forecasting error of 32% for certain types of companies.
In the 2-years-prior-to-failure-model, the same error of class 1 and 2 were found, and there is not a typical forecasting error of 27% for certain types of companies.
In model 3- years-prior-to-failure-model, the same error of class 1 and 2, and there is not a typical forecasting error of 29% for certain types of companies.
The purpose of the model: prediction of economic bankruptcy by court decision.
![Eric Verbaere's photo [Eric Verbaere ]](http://content.snauka.ru/web/5254_files/verbaeree.jpg) |
|
Eric Verbaere
|
Forecasting Object and Conditions: Dutch companies, mainly in Amsterdam. Scope: Industry and Trade.
The number of species of the technique: a method for the parent plus 5 sub-methods, based on two subsidiary methods.
Type of analysis: linear discriminant analysis.
Primary sample period for the analysis of the original model: the company for 1950 – 1975 years (25 years).
III) The Ooghe-Verbaere (OV) component in the Ooghe-Balcaen model
Eric Verbaere – is a well-known financial consultant and professor at the Ghent University, Belgium. For many years he worked with Hubert Ooghe, investigating the causes of failures in the companies. In particular, E. Verbaere is a specialist in industrial companies. The results of his research for many years are being used worldwide in predicting the bankruptcies.
1) The “old new” Ooghe-Verbaere model in the Ooghe-Balcaen model
a) Model of the crisis of the investment cycle: 3 years prior to bankruptcy (340):
![]()
In Ooghe-Verbaere models: X9 – is the amount of late /overdue/ payment of taxes (LPT) and the outstanding payments to social contributions (OPSC) with respect to short-term liabilities (STL). Outstanding amount is taken as a whole for the period, regardless of their maturity’s following facts:
![]() (341)
(341)
X16 – a ratio of profit / loss after tax (NP) and retained earnings (RetY) of the past to the sum of equity capital (OC(Eq)) and liabilities (TL):
![]() (342)
(342)
X13 – is the ratio of cash (MF) and direct cash equivalents / short-term investments (STI) / (MF + STI) to the sum of current / mobile / assets (MobA). STI express the amount of ready money, of “almost money” that can be quickly used to pay the arising liabilities.
![]() (343)
(343)
Note: Please note that in Russian accounting practice you will have to deduct the sum of the long-term accounts receivable from the mobile assets.
X14 – the ratio of the cost of: production in progress (PPC), finished goods and goods for resale (FG&GR) and goods shipped and dispatched (SDG) to the sum of net working capital (NWC = MobA – STL):
![]() (344)
(344)
X17 – a measure of the total return on permanent capital. The numerator is earnings before taxes and interest / EBIT /, at least, it is equal to the sum of operating profit (PBT), plus the interest paid (070 line in the profit and loss account plus (070), plus oversized percent to pay (%%): an interest that cannot be attributed to the 070 line / for example, the rate of 12.75 and more – from late 2010 to early 2011 in the Russian accountings/). The denominator is the sum of equity capital (OC(Eq)) and long-term liabilities (LTL).
![]() (345)
(345)
The critical point of the model is: les than – 0.2047, where “–” – is a minus sign.
b) Model of operating cycle crisis: two years prior to bankruptcy (346A):
![]()
Where coefficients: X9, X13, X14 – are described in the previous model.
X10 – The ratio of total profit or loss (NP) to the sum of equity capital (OC(Eq)) and liabilities (TL):
![]() (346)
(346)
X15 – the ratio of cash flow (CF) to revenue (Rev). CF – is the difference between the amount of income and the amount of payments for a company for a certain period. The net balance of cash flow at the beginning and end of the period is equal to the sum of money (MF): in the event when company is successful, it must comply with minimum balance of net cash flow.
![]() (347)
(347)
The critical point of the model is: less than – 0.2497, where “–” – is a minus sign.
c) Model of the crisis of the financial cycle: 1 year prior to bankruptcy (348):
![]()
Where: X11 – Gross yield (GY) before taxes in relation to total assets (TAS). GY – is an expressed in units of currency income from all assets before taxes and certain special payments (usually it relates to the payment of various court-appointed trustees, arbitrage anti-crisis managers and the other such-like special-purposes-equipped-staff). The concept of GY is close to the concept of PBT, as in the GY model the indicator is considered after the payment of interest and before taxes.
![]() (348A)
(348A)
X12 – the ratio of equity capital (OC(Eq)) to the sum of equity capital (OC(Eq)) and total liabilities (TL).
![]() (349)
(349)
The odds X9, X13, X10 have been described previously.
The critical point of the model: less than +2.0996.
According to Hubert Ooghe, E. Verbaere and Sofie Balcaen opinion, the model of Ooghe-Verbaere to be altered in accordance with more modern trends of economic development. For present purposes, they conducted a large study resulted in the updated model of Ooghe-Verbaere.
2) A new Ooghe-Verbaere technique, 2002.
a) Model of the crisis of the investment cycle: 3 years prior to bankruptcy (350):
![]()
Where: The coefficients X9, X16, X13, X14, X17 – have been explained earlier.
The critical point of the model is: less than – 0.4459, where “–” – is a minus sign.
b) Model of operating cycle crisis: two years prior to bankruptcy (351):
![]()
Where: The coefficients X10, X9, x13, X14, X15 – are explained earlier.
The critical point of the model is: less than – 0.3420, where “–” – is a minus sign.
c) Model of the crisis of the financial cycle: 1 year prior to bankruptcy (352):
![]()
Where: The coefficients X9, X10, X11, X12, X13 – are explained earlier.
The critical point of the model is: less than – 0.4515, where “–” – is a minus sign.
Results of Ooghe-Verbaere model probation (both old and new models).
Ooghe-Verbaere model was developed in Belgium for the evaluation of companies of Belgium, that is, according to the decoded full accountability data. Current research has shown that the old method gives good results in predicting bankruptcy.
Sample period for the old model was relatively small – from 1977 to 1980 (3 years). However, the size of the companies sample was essential. Ooghe-Verbaere model including sampling of all companies of all industries, not specializing in any particular sector of the economy. Ooghe-Verbaere studies led to the creation of another 5 models with different coefficients and discriminants, including 1 model for industrial companies. The new Ooghe-Verbaere model is also intended for use in all sectors.
The method is designed to predict not only the bankruptcy through the court decision, and also the bankruptcy, which had actually the place to be in court, and the company had managed to come to a peace settlement, or the company was able to pay off the debt during the procedures.
Model type: linear discriminant analysis.
IV) The Christina Zavgren model component (1985, USA) in a model of Ooghe-Balcaen
Analysis of C. Zavgren – this is not idle linear discriminant analysis, and the regression analysis method such as logit subspecies of logistic regression.
Doctor of Economics, Christina B. Zavgren was born in 1948 in the United States. She lives in New York. It starts from that point, the models to predict bankruptcy in less than 3 – 5 years term – have nothing positive to bring for a company. In her view, the current perspective is too short, and the company has no way to restore the activity to normal levels, if it is only left to the bankruptcy 1 or 3 years! C. Zavgren compares herself linear discriminant methods, and regression studies to predict the likelihood of bankruptcy with the “crystal ball”. Banks, third-party companies, the authorities concerned and the company itself from the inside when conducting such an analysis, it seems to test the balls for whether they are made of crystal or not! If so – then the company with a high probability can “break” due to abrupt changes in the environment of company existence. In this case, the company should know that it is made of “crystal” in advance, so it would have time enough to rebuild the “substance” of internal existence on something more solid! According to C.B. Zavgren, the first cause of failure of all the companies is too high concentration of debt. The second – is the decline in equity markets. The third reason for failure is excessive investment to inventories, which are logically instead of investment in the renewal of fixed assets, which would extend the company ‘life’ and make it more successful over the time at the competitive market.
All the indicators Z of all models of C. Zavgren to be given further – this is not the individual linear discriminant model, and the degree of the function Z-Logit. All models have the next index (U):
![LOGIT regression []](http://content.snauka.ru/web/5254_files/353.jpg) (353)
(353)
Where: e – is the exponent – a figure equal to 2.718281828. The exponent e in the Logit type analysis is always raised to the power z, equal to the total linear discriminant function Z:
![]() (354)
(354)
Where: a0 – a free term of regression, a1, a2, a3, …., an – is a linearly discriminants of discriminant analysis such as Logit. x1, x2, x3, …, xn – this are the financial ratios that are included in the model.
Author will no longer describe the Christina Zavgren model’s U component, and I will describe only the Z component of the linear-discriminant-function, knowing that the outcome of the function Z – is the degree to which one should raise the formula to receive the U indicator.
1) The “old new” Christine Zavgren model in the Ooghe-Balcaen model
a) Model of the crisis of the investment cycle: 3 years prior to bankruptcy (355):
Where for all the Christine Zavgren’s models: X18 – is the ratio of inventories (Inv) to the sum of the company’s revenues (Rev):
![]() (356)
(356)
X19 – is the ratio of accounts receivable (AR) to inventories (Inv):
![]() (357)
(357)
X20 – is the sum of money (MF) and short-term investments (STI) to company’s book value (TAS):
![]() (358)
(358)
X21 coefficient is a measure of instant liquidity of the company. The numerator of full instant liquidity is: MF plus STI plus instantaneous to claim amount of AR (ITCAAR). In the denominator there are the short-term and instant liabilities: if we shall call them the P1 and P2 where P – is passives, 1 – the most instant liabilities, 2 – short-term liabilities, than the denominator can be expressed as next. P1 – it would be the accounts payable (AP), indebtedness to the owners (shareholders), debts that were not covered in time. In Russian accountings, for instance, these would be line codes 620, 630 and 670 OKUD in the Balance sheet form. P2 – it would be the short-term liabilities: credits and loans with term less than 12 month; in Russian accounting accountings these would be line code 610 OKUD in the Balance sheet form.
![]() (359)
(359)
X6 – a net gain (after tax) / NP / in relation to equity capital (OC(Eq)):
![]() (360)
(360)
X5 – is the ratio of earnings (Rev) to total assets (TAS):
![]() (361)
(361)
X22 – a measure, the numerator of which is the amount of deferred income (DefIn), and accrued obligations (AcrO). DefIn – complies with the Russian accounting standards, that is, it is income received in this period and relating to the next.AcrO – is the amount of accrued liabilities and expenses to be paid before the end of the reporting period, and the fact of payment does not take place to be at a certain moment. In the Russian account of these concepts corresponds to the sum of short-term borrowings (STL). The denominator is the sum of equity capital (OC(Eq)):
![]() (362)
(362)
The critical point: less than +0.1829.
b) Model of operating cycle crisis: two years prior to bankruptcy (363):

The coefficients X18, X19, X20, X21, X6, X22, X5 – are described earlier.
The critical point: less than +0.0672.
c) Model of the crisis of the financial cycle: 1 year prior to bankruptcy (364):

The coefficients X18, X19, X20, X21, X6, X22, X5 – are described earlier.
The critical point: less than +0.4340.
2) A new method of Christine Zavgren, 2001.
Ooghe-Balcaen overestimated values of the coefficients for the specified method.
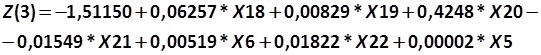
a) Model of the crisis of the investment cycle: 3 years prior to bankruptcy (365):
![A new method of Christine Zavgren [Christine Zavgren, Ghent University]](http://content.snauka.ru/web/5254_files/365.jpg)
The coefficients X18, X19, X20, X21, X6, X22, X5 – are described earlier.
The critical point: less than +0.7233.
b) Model of crisis operating cycle: two years prior to bankruptcy (366):
![A new method of Christine Zavgren [Christine Zavgren, Ghent University]](http://content.snauka.ru/web/5254_files/366.jpg)
The coefficients X18, X19, X20, X21, X6, X22, X5 – are described earlier.
The critical point: less than +0.7371.
c) Model of the crisis of the financial cycle: 1 year prior to bankruptcy (367):
![A new method of Christine Zavgren [Christine Zavgren, Ghent University]](http://content.snauka.ru/web/5254_files/367.jpg)
The coefficients X18, X19, X20, X21, X6, X22, X5 – are described earlier.
The critical point: less than +0.9150.
Data on testing of the model is next. Christine Zavgren’s model was developed in the United States. C. Zavgren comparing two simultaneous flow of financial information: data from the stock market and received from the financial statements’ data. All the data she collected on magnetic tape and processed by computer. C. Zavgren made a large sample of companies in the period from 1972 to 1978. The concept of bankruptcy is next. C. Zavgren interpreted Articles 10 and 11 of the Law on Insolvency (Bankruptcy) in the United States, that is, that the bankruptcy term is applicable for companies that had undergone external control and bankruptcy proceedings.
Instead of linear discriminant analysis, C. Zavgren used a close method of logistic regression constructing.
The model was very popular in the U.S. and has 05 subsidiaries models.
Next it will be considered other bankruptcy prediction models included in the Ooghe-Balcaen model.
V) Gloubos-Grammaticos model (1988, Greece)
The main author of the model is Theohari Grammaticos (03.01.1954-present). Born in Greece, studied in New York, in the New York University, where he earned a bachelor’s degree with honors (1976), Master of Finance (1980) and Ph.D. /finance/ (1982). In New York, he had the publication of his most significant research in the forecasting of trends in the securities market and prediction of bankruptcy, including the famous bankruptcy prediction model, known by many of today’s leading economic and financial experts of the world as one of the 3 – 5 best models to predict bankruptcy. Today, he moved to Luxembourg, and he has served as co-director of the European Investment Bank where he worked from 1990 to the present, and he teaches corporate finance at the University of Luxembourg since 2009.
Globos-Grammaticos model consists of two parallel types of analysis: linear discriminant analysis and logistic regression.
1) The “old new” Gloubos-Grammaticos model (GG)
1.1) The method of linear discriminant analysis
a) Model of the crisis of the investment cycle: 3 years prior to bankruptcy (368):
![]()
The coefficients X1 and X14 were discussed earlier.
X23 – this is the current liquidity ratio. In simple term, it is the sum of current assets (MobA) in relation to short-term liabilities (STL):
![]() (369)
(369)
X24 – is the ratio of long-term liabilities (LTL) to total assets (TAS).
![]() (370)
(370)
X25 – a relationship of EBITDA to total current liabilities. EBITDA – Earnings Before Taxes Depreciation and Amortization – the sum of earnings before interest, taxes, depreciation and maintenance for fixed assets. It corresponds approximately to the Russian practice of accounting operating profit (PBT) plus interest expense (code line 070 in the profit and loss account, the form number 2 on OKUD (070)) plus non-legislative interest (interest in excess of, dependent on the refinancing rate, which can be attributed at 070 line in Form number 2 in OKUD (%%)) plus depreciation (Am) (code line 140 from form number 5 on OKUD / Annex to the Balance Sheet / Line: depreciation of fixed assets, total).
![]() (371)
(371)
The critical point: less than +2.5515.
b) Model of operating cycle crisis: two years prior to bankruptcy (372):
![]()
Odds X23, X1, X24, X11, X25 – are explained earlier.
The critical point of the model: less than +2.2070.
c) Model of the crisis of the financial cycle: 1 year prior to bankruptcy (373):
![]()
Odds X23, X1, X24, X11, X25 – are explained earlier.
The critical point of the model: less than +2.2441.
1.2) The method of logistic regression logit / LOGIT / GG
a) Model of the crisis of the investment cycle: 3 years prior to bankruptcy (374):
![Gloubos-Grammaticos model (1988, Greece) [Gloubos-Grammaticos]](http://content.snauka.ru/web/5254_files/374.jpg)
Where e – is the exponent equal to 2.71828183 always. Exponent is raised to the power function. Let’s look at a specified power in details:
![]() (375)
(375)
This function is a mathematical function such as logistic regression called logit.
The coefficients X1, X11 and X24 have been explained earlier.
The critical point of the model: less than +0.9573.
b) Model of operating cycle crisis: two years prior to bankruptcy (376):
![Gloubos-Grammaticos model (1988, Greece) [Gloubos-Grammaticos]](http://content.snauka.ru/web/5254_files/376.jpg)
The model constants are not changing – the critical point is changing.
The coefficients X1, X11 and X24 have been explained earlier.
The critical point of the model is: +0.9848 / if at the same time more than +0.9573 – it speaks of a crisis in operating cycle /.
c) Model of the crisis of the financial cycle: 1 year prior to bankruptcy (377):
![Model of the crisis of the investment cycle: 3 years prior to bankruptcy [Gloubos-Grammaticos, Ghent University]](http://content.snauka.ru/web/5254_files/377.jpg)
The model constants are not changing – the critical point is changing.
The coefficients X1, X11 and X24 have been explained earlier.
The critical point of the model: less than +0.9444.
2) A new Gloubos-Grammaticos model (GG)
2.1) Linear discriminant analysis in GG model
a) Model of the crisis of the investment cycle: 3 years prior to bankruptcy (378):
![]()
Odds X23, X1, X24, X11, X25 – are explained earlier.
The critical point of the model was: – 0.0043, where “–” – is a minus sign.
b) Model of operating cycle crisis: two years prior to bankruptcy (379):
![]()
Odds X23, X1, X24, X11, X25 – are explained earlier.
The critical point of the model is: – 0.0006, where “–” – is a minus sign.
c) Model of the crisis of the financial cycle: 1 year prior to bankruptcy (380):
![]()
Odds X23, X1, X24, X11, X25 – are explained earlier.
The critical point of the model is: – 0.0033, where “–” – is a minus sign.
2.2) The method of logistic regression logit / LOGIT / GG
a) Model of the crisis of the investment cycle: 3 years prior to bankruptcy (390):
![A new Gloubos-Grammaticos model (GG) with re-estimated ratios and constants [Gloubos-Grammaticos, Ghent University]](http://content.snauka.ru/web/5254_files/390.jpg)
Let’s look at a specified power in detail:
![]() (391)
(391)
The critical point of the model: less than +0.8142.
b) Model of operating cycle crisis: two years prior to bankruptcy (392):
![A new Gloubos-Grammaticos model (GG) with re-estimated ratios and constants [Gloubos-Grammaticos, Ghent University]](http://content.snauka.ru/web/5254_files/392.jpg)
The critical point of the model: less than +0.8142 (the same as the previous one).
c) Model of the crisis of the financial cycle: 1 year prior to bankruptcy (393):
![A new Gloubos-Grammaticos model (GG) with re-estimated ratios and constants [Gloubos-Grammaticos, Ghent University]](http://content.snauka.ru/web/5254_files/393.jpg)
The critical point of the model: less than +0.8138.
VI) Model of K. Keasey and P. McGuinness (1990, 2009, UK)
The model uses the Keasey-McGuinness KM index:
![Model of K. Keasey and P. McGuinness (1990, 2009, UK) [K. Keasey and P. McGuinness, Ghent University]](http://content.snauka.ru/web/5254_files/394.jpg) (394)
(394)
In the future, the Z indicator calculation will be analyzed, understanding the KM index is taken into an account yet.
1) The “old new” Keasey-McGuinness model
a) Model of the crisis of the investment cycle: 3 years prior to bankruptcy (395):
![]()
Where: Bull figure X21 is already discussed – it is a measure of instant liquidity.
X26 – a relationship of raw materials and similar values (RM) to the amount payable (AP):
![]() (396)
(396)
X27 – the ratio of operating profit (PBT) to the amount of revenue (Rev):
![]() (397)
(397)
Critical rate: less than +0.1387.
b) Model of operating cycle crisis: two years prior to bankruptcy (398):
![]()
X1, X6 – have been described previously.
X18 – is the ratio of inventories (Inv) to the sum of the company’s revenues (Rev):
![]() (399)
(399)
X28 – the ratio of net profit (NP) to the sum of operating assets (OPA). OPA – this is the company’s assets that are directly involved in the main production activity: inventory, rearers and fatteners, work in progress, finished goods, equipment, buildings, accounts receivable, in particular, from buyers and customers. Sometimes there are to be included some other similar assets of that key.
![]() (400)
(400)
The critical point: less than +0.0131.
c) Model of the crisis of the financial cycle: 1 year prior to bankruptcy (401):
![]()
Odds X4, X26, X27 – are described earlier.
The critical point: less than +0.7939.
2) A new Keasey-McGuinness model
a) Model of the crisis of the investment cycle: 3 years prior to bankruptcy (402):
![]()
All the coefficients are explained above.
The critical point: less than +0.1387.
b) Model of operating cycle crisis: two years prior to bankruptcy (403):
![]()
Indicators X18, X1, X28, X6 are described previously.
The critical point: less than +0.7853.
c) Model of the crisis of the financial cycle: 1 year prior to bankruptcy (404):
![]()
All figures are interpreted earlier.
The critical point: less than +0.8980.
VII) A model of P. Joos, De Vos D. and Ooghe-Balcaen under development
The authors of the model: Hubert Ooghe, Sofie Balcaen, Jan Kamerlink and others. Unfortunately, this model is still being finalized. The authors of the methodology on the one hand, correct discriminants, on the other hand, analyze the results of the model. The authors are firmly fixed within their rights to publish even the first prototype of this model, that is why this part of model is out of estimation in this paper.
Despite the variety of models included in the model of Ooghe-Balcaen, the authors of the model have not yet thought through the issues analyzed by a combination of techniques and refined them by various authors. Because of this, the author of this paper investigated this issue, and I have developed my own model which estimates the probability of bankruptcy by the complex method of Ooghe-Balcaen. This method integrates and finalizes the 42-years-lasting study of the Ghent institute.
Author’s method of Alexander Shemetev for calculating the probability of failure and term prior to the bankruptcy, based on Ghent University studies
The author of this paper (Alexander Shemetev) developed a formula based on a combination of regression analysis and logit sample (binary quotient derivative distribution with given parameters), calculating the discriminants also suitable for this model. The formula of the author of this paper clarifies the model of Ooghe-Balcaen regarding the processing of the final result and the prediction of the probability of bankruptcy with high accuracy (at this time for the anti-crisis strategy realization):
![Author's method of Alexander Shemetev for calculating the probability of failure and term prior to the bankruptcy, based on Ghent University studies [Alexander Shemetev]](http://content.snauka.ru/web/5254_files/405.jpg) (405)
(405)
Where: The TTB (Time Till Bankruptcy) figure shows the minimum failure probability of the company timing in years. e – is the exponent, which is equal to 2.71828182845905. Ω – is a figure calculated by the following formula (406):
![Author's method of Alexander Shemetev for calculating the probability of failure and term prior to the bankruptcy, based on Ghent University studies [Alexander Shemetev]](http://content.snauka.ru/web/5254_files/406.jpg)
Where: Ω – is the extent shown above formulas to calculate the probable date of bankruptcy in years. If Ω is greater than 0, it indicates that the number of years over which is most likely the company will go bankrupt.
If Ω = 0,00000 exactly – it says that the company is perfectly resistant to the bankruptcy, regardless of the value of the exponent TTB / 0 indicator feature is caused by the calculation methodology /.
λ – is a measure of whether the method is New (N) or it is an Old one (O). The new method (N) – the method modified by Sofie Balcaen and Hubert Ooghe at the 1990s-2000s (they are represented in the model). The old method (O) – is a method: either the original or the modified by Hubert Ooghe and Sofia Balcaen in the 1970s – 1980s and in prior. The models are given in the description of the model as the old or new ones.
If the model is old, the rate λ is set to 0.3 (30%). If the model is new, the rate λ is set to 0.7 (70%). These proportions of the adequacy of the old and new models are designed by the author of this paper, from the comprehensive empirical material examination and effect calculation towards the old and new companies. The primary material to make the new models from the old ones was gathered by E. Verbaere, S. Balcaen and H. Ooghe mostly in 1970s – 2000s years and is provided by the Ghent University, Belgium.
Δ – is a measure that evaluates method’s trend for the last reporting period (it is better to take a year as a reporting period). If the trend is negative, i.e., the rate for the period is plunged more into a zone of high probability of bankruptcy, the coefficient Δ is equal to 1.015. If the trend is positive, and the company, according to the model, is in the area of high probability of bankruptcy, the coefficient Δ is 0.75. In all other cases the Δ meaning is not much important in the methodology developed by the author of this paper.
Indicator (I /Investment cycle/), after lettering the name in the model, indicates that the model used to forecast the crisis in the investment cycle (3 years prior to bankruptcy).
Indicator (O /Operational cycle/), after lettering the name of the model, indicates that the model is used to forecast the crisis in the operating cycle (2 years prior to bankruptcy).
Indicator (F /Financial cycle/), after lettering the name of the model, indicates that the model is used to forecast the crisis in the financial cycle (1 year prior to bankruptcy).
All other metrics show the values of different models for the prediction of bankruptcy, and they can take two values: 0 (the bankruptcy probability in a certain model is not observed) or 1 (a certain index indicates a high probability of bankruptcy); if some company according to some model is exactly on the border between the sustainable and unsustainable companies – we shall consider this company as a sustainable one.
EAO /Edward Altman Old model/ – a generic term for older (the “old” ones) models, designed by Edward Altman, which are available in the model of Ooghe-Balcaen. The index can take on two values: 1 – if the company is in the area of probability of bankruptcy, or 0 if the total value of the discriminant model is in the area of sustainable companies.
EAN /Edward Altman New model/ – is a common name for the new models, primary issued by Edward Altman, which than were modified and are available in a model of Ooghe-Balcaen. The index can take on two values: 1 – if the company is in the area of probability of bankruptcy, or 0 if the value of the discriminant model is in the area of sustainable companies.
BAO /J. Bilderbeek (Amsterdam) Old model/ – is a generic term for old models designed by J. Bilderbeek / Amsterdam /, which are available in the model of Ooghe-Balcaen. The index can take on two values: 1 – if the company is in the area of probability of bankruptcy, or 0 if the value of the discriminant model is in the area of sustainable companies.
BAN /J. Bilderbeek (Amsterdam) New model/ – is a common name for the new models developed by J. Bilderbeek / Amsterdam /, which are available in the Ooghe-Balcaen model. The index can take on two values: 1 – if the company is in the area of probability of bankruptcy, or 0 if the value of the discriminant model is in the area of sustainable companies.
OVO /Ooghe-Verbaere Old model/ – is a generic term for old Ooghe-Verbaere models available in Ooghe-Balcaen model. The index can take on two values: 1 – if the company is in the area of probability of bankruptcy, or 0 if the value of the discriminant model is in the area of sustainable companies.
OVN /Ooghe-Verbaere New model/ – is a generic term for new models of Ooghe-Verbaere available in Ooghe-Balcaen model. The index can take on two values: 1 – if the company is in the area of probability of bankruptcy, or 0 if the value of the discriminant model is in the area of sustainable companies.
CZO /Christine Zavgren Old model/ – is a generic term for old Christine Zavgren’s models available in Ooghe-Balcaen model. The index can take on two values: 1 – if the company is in the area of probability of bankruptcy, or 0 if the value of the discriminant model is in the area of sustainable companies.
CZN /Christine Zavgren New model/ – is a common name for the new models of Christine Zavgren available in Ooghe-Balcaen model. The index can take on two values: 1 – if the company is in the area of probability of bankruptcy, or 0 if the value of the discriminant model is in the area of sustainable companies.
GGO /Gloubos-Grammaticos Old models/ – is a generic term for old Gloubos-Grammaticos models available in the Ooghe-Balcaen model. The index can take on two values: 1 – if the company is in the area of probability of bankruptcy, or 0 if the value of the discriminant model is in the area of sustainable companies.
GGN /Gloubos-Grammaticos New models/ – is a common name for the new Gloubos-Grammaticos models available in the Ooghe-Balcaen model. The index can take on two values: 1 – if the company is in the area of probability of bankruptcy, or 0 if the value of the discriminant model is in the area of sustainable companies.
KMGO /K. Keasey and P. McGuinness Old models/ – is a generic term for old models of K. Keasey and P. McGuinness, available in a model of Ooghe-Balcaen. The index can take on two values: 1 – if the company is in the area of probability of bankruptcy, or 0 if the value of the discriminant model is in the area of sustainable companies.
KMGN /K. Keasey and P. McGuinness New models/ – is a common name for the new models of K. Keasey and P. McGuinness, available in a model of Ooghe-Balcaen. The index can take on two values: 1 – if the company is in the area of probability of bankruptcy, or 0 if the value of the discriminant model is in the area of sustainable companies.
If the rate of bankruptcy TTB is above 3 years (the maximum limit for forecasting the bankruptcy in the Ooghe-Balcaen model), it can be stated, that the company has some problems to be solved, and, in general, such companies’ failure, according to the Ooghe-Balcaen model, are not at risk. It should just be paid an attention to the indicators which show the crisis trends inside the bankruptcy prognosis models, instead of analyzing the total value of the models themselves.
If the indicator TTB has turned roughly equal 3 (+ / – 0.25 from the value in 3) or less than 3 years, it testifies about a crisis within the company and the need for urgent anti-crisis policy. Areas of anti-crisis policy should be planned, taking into account the values of the indicators inside the crisis-prognosis-methods, for instance, inside the models that show the probability of an event of bankruptcy.
The author of this paper developed an index TTB for clarity. The developed by the author of this paper TTB index lets us to cumulate and to preserve the 42-years-lasting research of the Ghent University in Belgium and the brilliant scientific works of many scientists from the Ghent University and from the worldwide – them to be used combined together in a synergy effect.
TTB presupposes the firms can make their financial report either fair or non-fair – of no difference on whether it is fair or unfair – the final result distortion will not be too much big. That is why some calculation methods and interpretation of some ratios used was a bit changed – to make the cumulative experience of the united researches more applicable to the crisis-reality of the nowadays.
The TTB index so may be used as the Key-Performing-Indicator (KPI) that provides an additional data about certain firms in a certain market segment analysis. This TTB KPI may reveal the hidden problem that may crush some certain enterprises at the same time when the other models and methods can not to reveal this fact. By analyzing the models that are included in the TTB and the ratios that are included in the models themselves an analyst may reveal a certain hidden crisis inside an enterprise. The less the value of TTB is – the more profound analysis is needed: from the up (TTB) to the down up till the ratios included in certain models that reveal the crisis in a certain enterprise.
By comparing the TTB of one enterprise with the other enterprises in the market, an analyst may receive an additional picture on how his or her firm positions itself in the market through the new prism: how much time is left to some certain scope of firms at certain market segment….
In common say, when calculating the TTB indicator, you, dear reader, may estimate how much Time Till Bankruptcy for a certain company is left if not to realize the urgent anti-crisis-financial-management-strategy. The TTB is calculated in estimated years till bankruptcy which can be recalculated in exact days till the expected bankruptcy which is equal to the time left on urgent anti-crisis policy measures realization.
This is the end of this discussion about the wonderful experience and successes achieved in bankruptcy forecasting sphere for the last 42 years in the Ghent University, Belgium, and also about the accumulation of this experience in one TTBindex formula to achieve a synergy effect.
List of sources used in brief description: the publications of the above-mentioned authors which experience was combined in the Ghent University study: Edward I. Altman (1968, 1982, 1997 (together with P. Narayanan); H. Ooghe, S. Balcaen, E. Verbaere, De Vos D., P. Joos, J. Camerlynck, Van Wymeersch, C. De Bourdeaudhuy, (42 years of study); K. Keasey, P. McGuinness, H. Short (1990 – 1992); R.J. Taffler (1982, 1995) and H.J. Tishaw (1977); C. Zavgren (1985); J. Bilderbeek (1979); T. Bell, G. Ribar, J. Verchio (1990); Gloubos-Grammaticos model and the other authors mentioned in the text; also the working papers of the Ghent University, Belgium.